## Line Chart: Reward vs Steps (Mean Min/Max)
### Overview
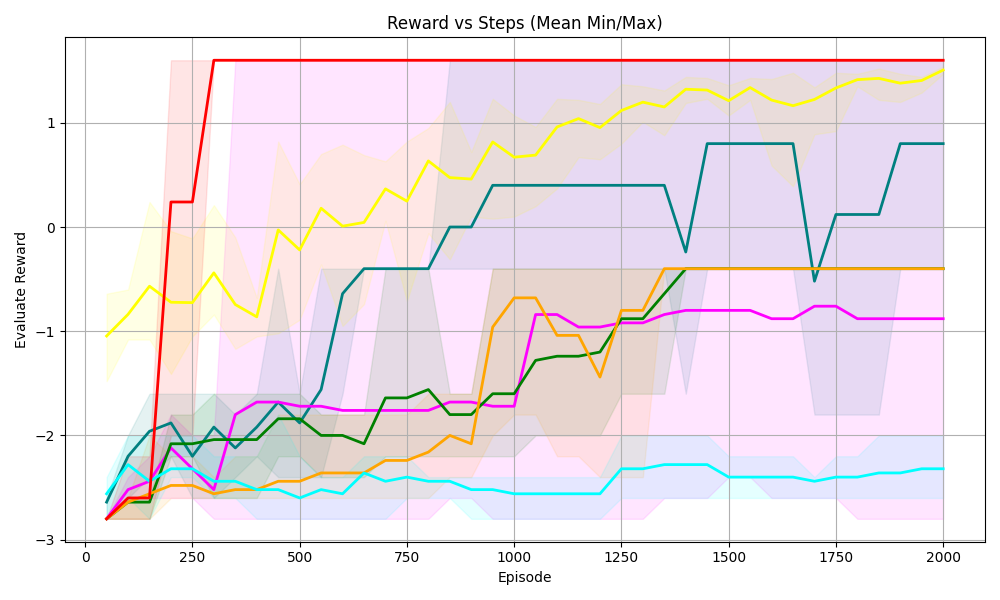
The image is a line chart that plots the "Evaluate Reward" against "Episode" steps. It shows the mean, minimum, and maximum reward values for multiple data series, each represented by a different colored line. The chart includes a grid for easier reading and shaded regions indicating the min/max range for each series.
### Components/Axes
* **Title:** Reward vs Steps (Mean Min/Max)
* **X-axis:** Episode, with markers at 0, 250, 500, 750, 1000, 1250, 1500, 1750, and 2000.
* **Y-axis:** Evaluate Reward, with markers at -3, -2, -1, 0, and 1.
* **Data Series:** There are six distinct data series, each represented by a different color: red, yellow, teal, dark green, orange, and magenta. Each series has a solid line representing the mean reward and a shaded area around the line representing the min/max range.
### Detailed Analysis
**Red Series:**
* **Trend:** The red line increases sharply from approximately -2.75 to 1.25 between episode 0 and 250, then remains constant at approximately 1.25 until episode 2000.
* **Min/Max Range:** The shaded area is relatively narrow, indicating a small variance.
**Yellow Series:**
* **Trend:** The yellow line starts at approximately -1 at episode 0, fluctuates between -1 and 1.25 until episode 2000.
* **Min/Max Range:** The shaded area is wider than the red series, indicating a larger variance.
**Teal Series:**
* **Trend:** The teal line starts at approximately -2.75 at episode 0, increases to approximately -2.25 by episode 250, and then remains relatively constant between -2.25 and -2.5 until episode 2000.
* **Min/Max Range:** The shaded area is relatively narrow, indicating a small variance.
**Dark Green Series:**
* **Trend:** The dark green line starts at approximately -2.75 at episode 0, increases to approximately -1.75 by episode 500, fluctuates between -2 and -1 until episode 1250, and then remains relatively constant between -1.25 and -1.5 until episode 2000.
* **Min/Max Range:** The shaded area is wider than the red series, indicating a larger variance.
**Orange Series:**
* **Trend:** The orange line starts at approximately -2.75 at episode 0, increases to approximately -2.5 by episode 250, increases to approximately -2 by episode 500, increases to approximately -1.75 by episode 750, increases to approximately -0.5 by episode 1000, and then remains relatively constant between -0.5 and -0.25 until episode 2000.
* **Min/Max Range:** The shaded area is wider than the red series, indicating a larger variance.
**Magenta Series:**
* **Trend:** The magenta line starts at approximately -2.75 at episode 0, increases to approximately -2.5 by episode 250, increases to approximately -1.75 by episode 500, and then remains relatively constant between -1.75 and -1.5 until episode 2000.
* **Min/Max Range:** The shaded area is wider than the red series, indicating a larger variance.
### Key Observations
* The red series shows the most rapid and stable increase in reward, reaching a high plateau early on.
* The yellow series exhibits the most fluctuation in reward.
* The teal series shows the least improvement in reward over the episodes.
* The other series (dark green, orange, and magenta) show gradual improvements in reward over time.
* The min/max ranges vary across the series, indicating different levels of stability or variance in the reward values.
### Interpretation
The chart compares the performance of different agents or algorithms (represented by the different colored lines) in terms of reward earned over a series of episodes. The red series demonstrates the most successful and stable learning, quickly achieving a high reward and maintaining it. The yellow series, on the other hand, shows inconsistent performance. The other series show varying degrees of learning progress. The shaded areas provide insight into the consistency of the reward for each agent, with wider areas indicating more variability. The data suggests that the red agent/algorithm is the most effective in this environment, while the yellow agent/algorithm may require further tuning or a different approach.