## Bar Chart: Performance Comparison by Instruction Set and Architecture
### Overview
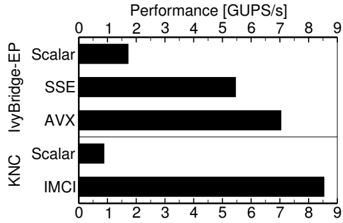
The chart compares computational performance (in GUPS/s) across two architectures ("KNC IvyBridge-EP" and "KNC") for different instruction sets: Scalar, SSE, AVX, and IMCI. Performance values are represented as horizontal bars, with longer bars indicating higher throughput.
### Components/Axes
- **X-axis**: Performance [GUPS/s] (scale: 0–9, linear increments of 1)
- **Y-axis**:
- Primary categories:
1. "KNC IvyBridge-EP"
2. "KNC"
- Subcategories (nested under primary categories):
- "KNC IvyBridge-EP": Scalar, SSE, AVX
- "KNC": Scalar, IMCI
- **Legend**: Not explicitly labeled; subcategories are visually grouped under their respective primary categories.
### Detailed Analysis
- **KNC IvyBridge-EP**:
- **Scalar**: ~1.5 GUPS/s (shortest bar)
- **SSE**: ~5.2 GUPS/s (medium-length bar)
- **AVX**: ~7.0 GUPS/s (longest bar in this category)
- **KNC**:
- **Scalar**: ~0.8 GUPS/s (shortest bar overall)
- **IMCI**: ~8.5 GUPS/s (longest bar overall)
### Key Observations
1. **IMCI in "KNC"** achieves the highest performance (~8.5 GUPS/s), outperforming all other configurations.
2. **AVX in "KNC IvyBridge-EP"** is the second-highest performer (~7.0 GUPS/s).
3. **Scalar** is the least performant across both architectures (~0.8–1.5 GUPS/s).
4. **SSE** in "KNC IvyBridge-EP" (~5.2 GUPS/s) underperforms compared to AVX and IMCI.
### Interpretation
The data suggests that instruction set optimization significantly impacts computational efficiency. IMCI in the "KNC" architecture demonstrates the highest throughput, indicating it may leverage advanced parallelism or hardware acceleration. The "KNC IvyBridge-EP" architecture shows diminishing returns from Scalar to SSE to AVX, but IMCI in "KNC" breaks this trend, suggesting architectural differences between the two systems. The stark contrast between Scalar and optimized instruction sets highlights the importance of leveraging specialized hardware instructions for performance-critical applications.