## Bar Chart: Performance Comparison of IvyBridge-EP and KNC
### Overview
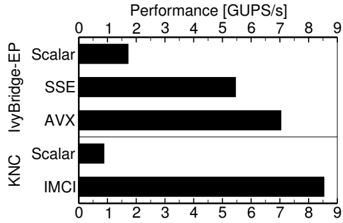
The image is a horizontal bar chart comparing the performance of IvyBridge-EP and KNC architectures using different instruction sets (Scalar, SSE, AVX, and IMCI). The performance is measured in GUPS/s (Giga Updates Per Second).
### Components/Axes
* **Y-axis (left):** Architecture and Instruction Set
* IvyBridge-EP: Scalar, SSE, AVX
* KNC: Scalar, IMCI
* **X-axis (top and bottom):** Performance [GUPS/s]
* Scale: 0 to 9, with integer markings at each value.
### Detailed Analysis
* **IvyBridge-EP:**
* **Scalar:** Performance is approximately 1.5 GUPS/s.
* **SSE:** Performance is approximately 5.5 GUPS/s.
* **AVX:** Performance is approximately 7 GUPS/s.
* **KNC:**
* **Scalar:** Performance is approximately 0.8 GUPS/s.
* **IMCI:** Performance is approximately 8.8 GUPS/s.
### Key Observations
* For IvyBridge-EP, performance increases from Scalar to SSE to AVX.
* KNC's IMCI performance significantly outperforms its Scalar performance.
* IMCI on KNC has the highest performance among all configurations tested.
### Interpretation
The chart demonstrates the performance differences between IvyBridge-EP and KNC architectures when using different instruction sets. The results suggest that vectorization (SSE and AVX on IvyBridge-EP, and IMCI on KNC) significantly improves performance compared to scalar operations. KNC's IMCI instruction set provides the highest performance, indicating its efficiency for the tested workload. The data highlights the importance of instruction set selection for optimizing performance on different architectures.