TECHNICAL ASSET FINGERPRINT
fda69372e351cfba2bdaa95e
Click to view fullscreen
Press ESC or click to close
FOUND IN PAPERS
EXPERT: gemini-2.0-flash VERSION 1
RUNTIME: nugit/gemini/gemini-2.0-flash
INTEL_VERIFIED
## Causal Reasoning Diagram: Balloon Expansion
### Overview
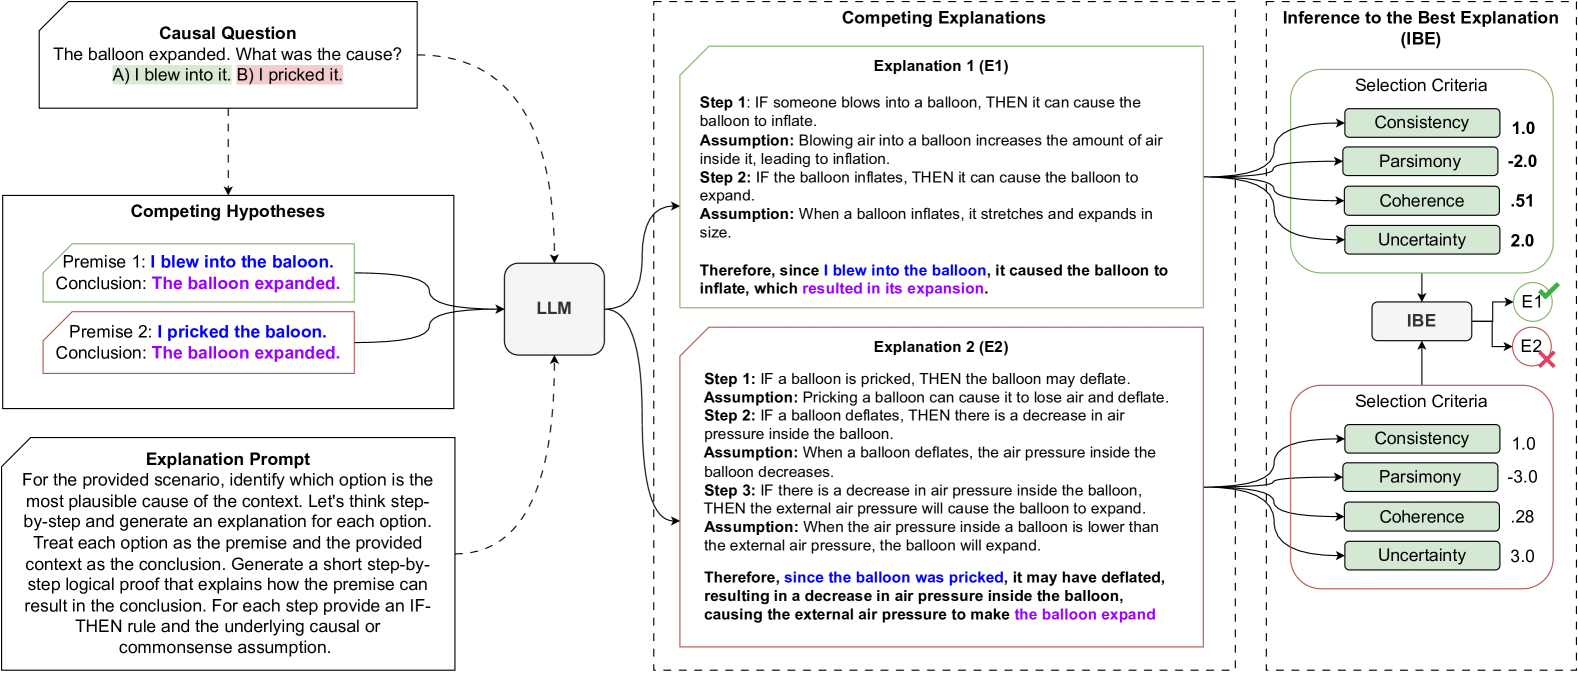
The image presents a diagram illustrating a causal reasoning process, specifically focusing on determining the cause of a balloon's expansion. It outlines competing hypotheses, explanations generated by a Large Language Model (LLM), and an Inference to the Best Explanation (IBE) framework to evaluate these explanations.
### Components/Axes
The diagram is divided into three main sections:
1. **Causal Question:** Poses the problem: "The balloon expanded. What was the cause? A) I blew into it. B) I pricked it."
2. **Competing Hypotheses:** Presents two premises:
* Premise 1: "I blew into the balloon. Conclusion: The balloon expanded." (highlighted in green)
* Premise 2: "I pricked the balloon. Conclusion: The balloon expanded." (highlighted in red)
3. **Explanation Prompt:** Provides instructions for generating explanations for each option, treating each option as a premise and generating a step-by-step logical proof.
4. **LLM:** A central node representing the Large Language Model that processes the hypotheses and generates explanations.
5. **Competing Explanations:** Presents two explanations generated by the LLM:
* Explanation 1 (E1): Based on blowing into the balloon.
* Explanation 2 (E2): Based on pricking the balloon.
6. **Inference to the Best Explanation (IBE):** Evaluates the explanations based on selection criteria.
### Detailed Analysis or Content Details
**1. Causal Question and Competing Hypotheses:**
* The causal question sets up the problem: "The balloon expanded. What was the cause?" with two possible answers: "A) I blew into it" and "B) I pricked it."
* The competing hypotheses frame these answers as premises leading to the conclusion that "The balloon expanded."
**2. Explanation Prompt:**
* The prompt instructs the system to identify the most plausible cause and generate step-by-step explanations for each option.
* It emphasizes the use of IF-THEN rules and commonsense assumptions.
**3. LLM:**
* The LLM acts as the central processing unit, taking the hypotheses and prompt as input and generating explanations.
**4. Competing Explanations:**
* **Explanation 1 (E1):**
* Step 1: "IF someone blows into a balloon, THEN it can cause the balloon to inflate."
* Assumption: "Blowing air into a balloon increases the amount of air inside it, leading to inflation."
* Step 2: "IF the balloon inflates, THEN it can cause the balloon to expand."
* Assumption: "When a balloon inflates, it stretches and expands in size."
* Conclusion: "Therefore, since I blew into the balloon, it caused the balloon to inflate, which resulted in its expansion."
* **Explanation 2 (E2):**
* Step 1: "IF a balloon is pricked, THEN the balloon may deflate."
* Assumption: "Pricking a balloon can cause it to lose air and deflate."
* Step 2: "IF a balloon deflates, THEN there is a decrease in air pressure inside the balloon."
* Assumption: "When a balloon deflates, there is a decrease in air pressure inside the balloon."
* Step 3: "IF there is a decrease in air pressure inside the balloon, THEN the external air pressure will cause the balloon to expand."
* Assumption: "When the air pressure inside a balloon is lower than the external air pressure, the balloon will expand."
* Conclusion: "Therefore, since the balloon was pricked, it may have deflated, resulting in a decrease in air pressure inside the balloon, causing the external air pressure to make the balloon expand."
**5. Inference to the Best Explanation (IBE):**
* **Explanation 1 (E1) Evaluation:**
* Consistency: 1.0
* Parsimony: -2.0
* Coherence: 0.51
* Uncertainty: 2.0
* Result: E1 is accepted (green checkmark)
* **Explanation 2 (E2) Evaluation:**
* Consistency: 1.0
* Parsimony: -3.0
* Coherence: 0.28
* Uncertainty: 3.0
* Result: E2 is rejected (red X)
### Key Observations
* The diagram illustrates a structured approach to causal reasoning, using an LLM to generate explanations and an IBE framework to evaluate them.
* The selection criteria (Consistency, Parsimony, Coherence, Uncertainty) are used to quantify the quality of each explanation.
* Explanation 1 (blowing into the balloon) is favored over Explanation 2 (pricking the balloon) based on the IBE evaluation.
### Interpretation
The diagram demonstrates a process for automated causal reasoning. The LLM generates explanations based on provided premises, and the IBE framework provides a quantitative method for selecting the best explanation. The specific values assigned to the selection criteria (Consistency, Parsimony, Coherence, Uncertainty) reflect the relative strengths and weaknesses of each explanation. In this case, the "blowing into the balloon" explanation is deemed more plausible than the "pricking the balloon" explanation, suggesting that the LLM and IBE framework favor the former as the cause of the balloon's expansion. The negative parsimony values indicate a penalty for complexity in the explanations. The lower coherence and higher uncertainty for Explanation 2 contribute to its rejection.
DECODING INTELLIGENCE...
EXPERT: nemotron-free VERSION 1
RUNTIME: free/nvidia/nemotron-nano-12b-v2-vl:free
INTEL_VERIFIED
## Flowchart: Causal Reasoning and Explanation Evaluation
### Overview
The image depicts a structured reasoning framework for evaluating causal explanations. It consists of four interconnected sections:
1. **Causal Question** (top-left)
2. **Competing Hypotheses** (bottom-left)
3. **Competing Explanations** (center-right)
4. **Inference to the Best Explanation (IBE)** (rightmost)
The flowchart uses color-coded boxes, dashed arrows, and textual annotations to represent logical relationships and evaluation criteria.
---
### Components/Axes
#### Causal Question Section
- **Text Box**:
- Label: "Causal Question"
- Content:
- Premise: "The balloon expanded."
- Question: "What was the cause?"
- Options:
- A) "I blew into it." (highlighted green)
- B) "I pricked it." (highlighted red)
#### Competing Hypotheses Section
- **Two Hypothesis Boxes**:
1. **Green Box (Premise 1)**:
- Premise: "I blew into the balloon."
- Conclusion: "The balloon expanded."
2. **Red Box (Premise 2)**:
- Premise: "I pricked the balloon."
- Conclusion: "The balloon expanded."
- **Explanation Prompt**:
- Text instructing step-by-step explanation generation for each hypothesis.
#### Competing Explanations Section
- **Two Explanation Boxes**:
1. **Green Box (E1)**:
- **Step 1**: "IF someone blows into a balloon, THEN it can cause the balloon to inflate."
- Assumption: Blowing air increases internal air volume.
- **Step 2**: "IF the balloon inflates, THEN it can cause the balloon to expand."
- Assumption: Inflation stretches the balloon.
- Final Statement: "Therefore, since I blew into the balloon, it caused the balloon to inflate, which resulted in its expansion."
2. **Red Box (E2)**:
- **Step 1**: "IF a balloon is pricked, THEN the balloon may deflate."
- Assumption: Pricking causes air loss.
- **Step 2**: "IF a balloon deflates, THEN there is a decrease in air pressure inside the balloon."
- Assumption: Deflation reduces internal pressure.
- **Step 3**: "IF there is a decrease in air pressure inside the balloon, THEN the external air pressure will cause the balloon to expand."
- Assumption: Lower internal pressure allows external pressure to expand the balloon.
- Final Statement: "Therefore, since the balloon was pricked, it may have deflated, resulting in a decrease in air pressure inside the balloon, causing the external air pressure to make the balloon expand."
#### Inference to the Best Explanation (IBE) Section
- **Selection Criteria**:
- **Consistency**: 1.0 (E1) vs. 1.0 (E2)
- **Parsimony**: -2.0 (E1) vs. -3.0 (E2)
- **Coherence**: 0.51 (E1) vs. 0.28 (E2)
- **Uncertainty**: 2.0 (E1) vs. 3.0 (E2)
- **IBE Output**:
- Selected Explanation: E1 (marked with a green checkmark).
---
### Detailed Analysis
#### Causal Question Section
- **Textual Content**:
- Premise: "The balloon expanded."
- Question: "What was the cause?"
- Options:
- A) "I blew into it." (highlighted green)
- B) "I pricked it." (highlighted red)
#### Competing Hypotheses Section
- **Premise 1 (Green Box)**:
- Logical Structure:
- Premise → Conclusion: "I blew into the balloon" → "The balloon expanded."
- **Premise 2 (Red Box)**:
- Logical Structure:
- Premise → Conclusion: "I pricked the balloon" → "The balloon expanded."
#### Competing Explanations Section
- **E1 (Green Box)**:
- **Step 1**:
- Conditional: "IF someone blows into a balloon, THEN it can cause the balloon to inflate."
- Assumption: Blowing air increases internal air volume.
- **Step 2**:
- Conditional: "IF the balloon inflates, THEN it can cause the balloon to expand."
- Assumption: Inflation stretches the balloon.
- **Final Statement**: Links Premise 1 to the conclusion via inflation.
- **E2 (Red Box)**:
- **Step 1**:
- Conditional: "IF a balloon is pricked, THEN the balloon may deflate."
- Assumption: Pricking causes air loss.
- **Step 2**:
- Conditional: "IF a balloon deflates, THEN there is a decrease in air pressure inside the balloon."
- Assumption: Deflation reduces internal pressure.
- **Step 3**:
- Conditional: "IF there is a decrease in air pressure inside the balloon, THEN the external air pressure will cause the balloon to expand."
- Assumption: Lower internal pressure allows external pressure to expand the balloon.
- **Final Statement**: Links Premise 2 to the conclusion via deflation and pressure dynamics.
#### Inference to the Best Explanation (IBE) Section
- **Selection Criteria**:
- **Consistency**: Both E1 and E2 score 1.0 (fully consistent with the conclusion).
- **Parsimony**: E1 (-2.0) is simpler than E2 (-3.0).
- **Coherence**: E1 (0.51) is more logically coherent than E2 (0.28).
- **Uncertainty**: E1 (2.0) has lower uncertainty than E2 (3.0).
- **IBE Output**:
- E1 is selected as the best explanation due to higher parsimony, coherence, and lower uncertainty.
---
### Key Observations
1. **Contradictory Hypotheses, Shared Conclusion**:
- Both hypotheses (blowing vs. pricking) lead to the same conclusion ("The balloon expanded"), requiring explanation evaluation.
2. **Explanation Complexity**:
- E1 uses two steps (inflation → expansion).
- E2 uses three steps (deflation → pressure drop → expansion), making it less parsimonious.
3. **Selection Criteria Trade-offs**:
- E1 scores better on parsimony and coherence but has higher uncertainty than E2.
- E2's higher uncertainty and lower coherence make it less favorable despite similar consistency.
4. **Logical Flow**:
- Dashed arrows connect hypotheses to explanations, which then feed into IBE.
---
### Interpretation
The flowchart illustrates a formalized process for causal reasoning:
1. **Hypothesis Generation**: Two competing causes (blowing vs. pricking) are proposed.
2. **Explanation Construction**: Each hypothesis is expanded into a step-by-step causal chain with explicit assumptions.
3. **Evaluation via IBE**: Explanations are scored on four criteria:
- **Consistency**: How well the explanation aligns with observed data.
- **Parsimony**: Simplicity of the explanation (fewer assumptions).
- **Coherence**: Logical consistency of the explanation's steps.
- **Uncertainty**: Degree of ambiguity in the explanation.
**Why E1 is Selected**:
- E1's explanation (blowing → inflation → expansion) is simpler (fewer steps) and more coherent than E2's (pricking → deflation → pressure drop → expansion).
- While E2 introduces a plausible physical mechanism (external pressure causing expansion after deflation), its added complexity and higher uncertainty make it less favorable.
**Notable Anomaly**:
- The conclusion "The balloon expanded" is counterintuitive for Premise 2 ("I pricked it"), as pricking typically causes deflation. E2 resolves this by invoking external pressure dynamics, but this introduces additional assumptions, increasing uncertainty.
This framework demonstrates how logical reasoning systems can evaluate explanations by balancing simplicity, coherence, and alignment with observed outcomes.
DECODING INTELLIGENCE...