## Line Chart: COCO AP vs Inference Time for Object Detection Models
### Overview
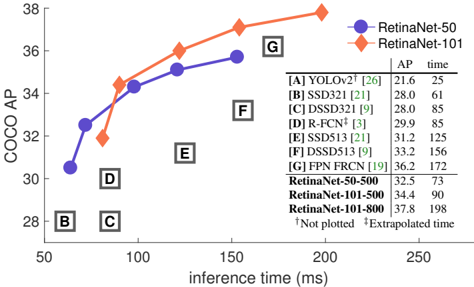
The chart compares the performance (COCO Average Precision, AP) of various object detection models against their inference time (in milliseconds). Two primary data series are plotted: RetinaNet-50 (blue circles) and RetinaNet-101 (orange diamonds). A table on the right lists additional models with their AP and time values.
### Components/Axes
- **X-axis**: Inference time (ms), ranging from 50 to 250 ms in 50 ms increments.
- **Y-axis**: COCO AP, ranging from 28 to 38 in 2-point increments.
- **Legend**: Located in the top-right corner, with:
- Blue circles: RetinaNet-50
- Orange diamonds: RetinaNet-101
- **Table**: Right-aligned, listing models with AP and time values (see Content Details).
### Detailed Analysis
1. **RetinaNet-50 (Blue Line)**:
- Starts at ~32.5 AP at 73 ms (point D).
- Increases to ~34.4 AP at 90 ms (point F).
- Shows a steady upward trend with minimal time increase.
2. **RetinaNet-101 (Orange Line)**:
- Begins at ~34.4 AP at 90 ms (point F).
- Rises to ~37.8 AP at 198 ms (point G).
- Demonstrates a steeper slope, indicating faster AP gains with increased time.
3. **Table Data**:
The following table lists the models (A to G) with their AP and inference time:
| Model | AP | Time (ms) | Note |
|-------|----|-----------|------|
| YOLOv2 | 21.6 | 25 | † |
| SSD321 | 28.0 | 61 | |
| DSSD321 | 28.0 | 85 | |
| R-FCN | 29.9 | 85 | ‡ |
| SSD513 | 31.2 | 125 | |
| DSSD513 | 33.2 | 156 | |
| FPN FRCN | 36.2 | 172 | |
**RetinaNet Variants**:
- RetinaNet-50-500: 32.5 AP, 73 ms
- RetinaNet-101-500: 34.4 AP, 90 ms
- RetinaNet-101-800: 37.8 AP, 198 ms
**Footnotes**:
- †: Not plotted
- ‡: Extrapolated time
### Key Observations
- **Performance-Time Tradeoff**: RetinaNet-101 achieves higher AP but requires significantly more inference time than RetinaNet-50.
- **Extrapolation**: R-FCN's time (85 ms) is marked as extrapolated, suggesting uncertainty in its placement.
- **Model Efficiency**: RetinaNet-50-500 matches RetinaNet-101-500 in AP (34.4) but with 17 ms faster inference.
- **Outlier**: YOLOv2 (A) has the lowest AP (21.6) but fastest time (25 ms), indicating poor accuracy for speed.
### Interpretation
The chart illustrates a clear tradeoff between accuracy and computational efficiency in object detection models. RetinaNet-101 variants dominate in AP but demand higher inference times, making them suitable for applications prioritizing precision (e.g., medical imaging). RetinaNet-50 offers a balance, while models like YOLOv2 prioritize speed at the cost of accuracy. The extrapolated time for R-FCN raises questions about its real-world applicability. The table's ordering suggests a correlation between AP and inference time, though exceptions exist (e.g., RetinaNet-50-500 vs. RetinaNet-101-500). This data is critical for optimizing model selection in resource-constrained environments.