## Chart: Loss vs. Model Size
### Overview
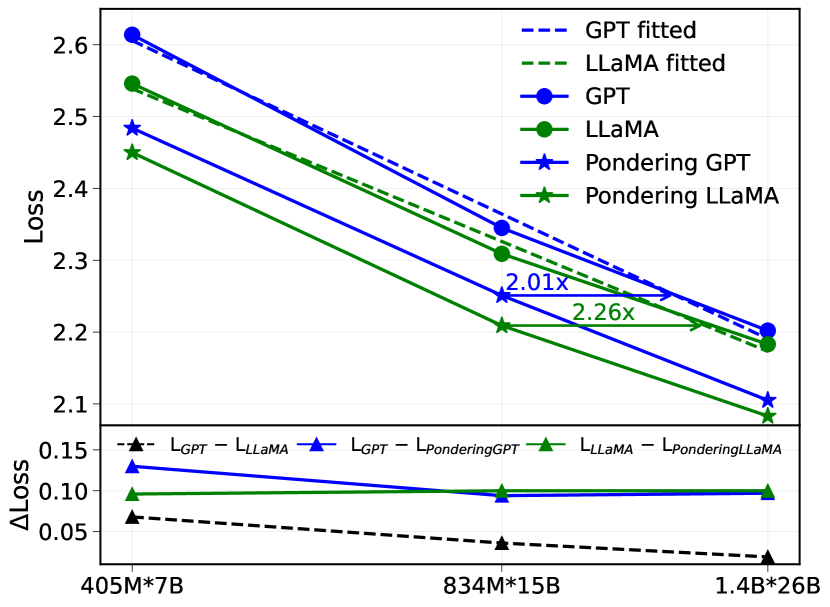
The image is a line chart comparing the loss of different language models (GPT, LLaMA, Pondering GPT, and Pondering LLaMA) across varying model sizes (405M*7B, 834M*15B, and 1.4B*26B). It also shows the difference in loss between GPT and LLaMA, GPT and Pondering GPT, and LLaMA and Pondering LLaMA.
### Components/Axes
* **Y-axis (left)**: "Loss", ranging from 2.1 to 2.6 in increments of 0.1.
* **X-axis (bottom)**: Model sizes: "405M*7B", "834M*15B", and "1.4B*26B".
* **Lower Y-axis (left)**: "ΔLoss", ranging from 0.05 to 0.15 in increments of 0.05.
* **Legend (top-right)**:
* "GPT fitted" (dashed blue line)
* "LLaMA fitted" (dashed green line)
* "GPT" (solid blue line with circle markers)
* "LLaMA" (solid green line with circle markers)
* "Pondering GPT" (solid blue line with star markers)
* "Pondering LLaMA" (solid green line with star markers)
* "L<sub>GPT</sub> - L<sub>LLaMA</sub>" (dashed black line with triangle markers)
* "L<sub>GPT</sub> - L<sub>PonderingGPT</sub>" (solid blue line with triangle markers)
* "L<sub>LLaMA</sub> - L<sub>PonderingLLaMA</sub>" (solid green line with triangle markers)
### Detailed Analysis
**Main Chart (Loss vs. Model Size):**
* **GPT (solid blue line with circle markers):** Decreases from approximately 2.62 at 405M*7B to approximately 2.19 at 1.4B*26B.
* **LLaMA (solid green line with circle markers):** Decreases from approximately 2.54 at 405M*7B to approximately 2.18 at 1.4B*26B.
* **Pondering GPT (solid blue line with star markers):** Decreases from approximately 2.48 at 405M*7B to approximately 2.09 at 1.4B*26B.
* **Pondering LLaMA (solid green line with star markers):** Decreases from approximately 2.45 at 405M*7B to approximately 2.10 at 1.4B*26B.
* **GPT fitted (dashed blue line):** Decreases from approximately 2.6 at 405M*7B to approximately 2.2 at 1.4B*26B.
* **LLaMA fitted (dashed green line):** Decreases from approximately 2.55 at 405M*7B to approximately 2.17 at 1.4B*26B.
**Difference Chart (ΔLoss):**
* **L<sub>GPT</sub> - L<sub>LLaMA</sub> (dashed black line with triangle markers):** Decreases slightly from approximately 0.07 at 405M*7B to approximately 0.02 at 1.4B*26B.
* **L<sub>GPT</sub> - L<sub>PonderingGPT</sub> (solid blue line with triangle markers):** Remains relatively constant at approximately 0.13-0.10 across all model sizes.
* **L<sub>LLaMA</sub> - L<sub>PonderingLLaMA</sub> (solid green line with triangle markers):** Remains relatively constant at approximately 0.10-0.09 across all model sizes.
**Annotations:**
* An arrow points from the LLaMA line at 834M*15B to the LLaMA line at 1.4B*26B, labeled "2.01x".
* An arrow points from the Pondering LLaMA line at 834M*15B to the Pondering LLaMA line at 1.4B*26B, labeled "2.26x".
### Key Observations
* All models show a decrease in loss as the model size increases.
* Pondering GPT and Pondering LLaMA consistently have lower loss than GPT and LLaMA, respectively.
* The difference in loss between GPT and LLaMA decreases as the model size increases.
* The difference in loss between GPT and Pondering GPT, and LLaMA and Pondering LLaMA, remains relatively constant across all model sizes.
* The "fitted" lines are very close to the original lines.
### Interpretation
The chart demonstrates that increasing model size generally leads to lower loss for all models tested (GPT, LLaMA, and their "Pondering" variants). The "Pondering" versions of the models consistently outperform their non-pondering counterparts, suggesting that the "Pondering" technique is effective in reducing loss. The decreasing difference in loss between GPT and LLaMA as model size increases suggests that the two models converge in performance as they scale. The annotations "2.01x" and "2.26x" likely refer to the relative improvement in some metric (possibly perplexity or another measure of language modeling performance) between the 834M*15B and 1.4B*26B model sizes for LLaMA and Pondering LLaMA, respectively. The "fitted" lines likely represent a smoothed or regression-based representation of the original data.