\n
## Chart: Loss vs. Model Size
### Overview
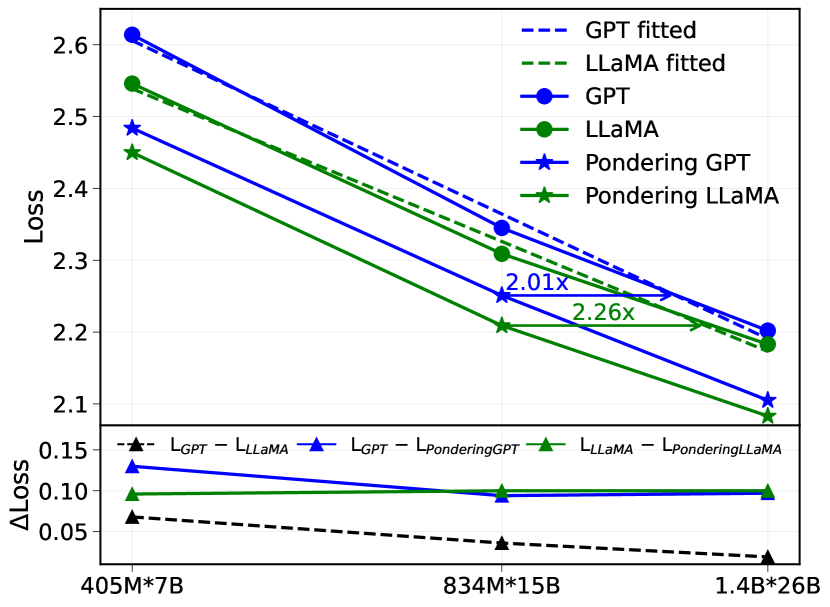
The image presents a line chart comparing the loss values of different language models (GPT and LLaMA) with and without "Pondering" as a function of model size. The chart also includes a smaller subplot showing the change in loss (ΔLoss) for each model.
### Components/Axes
* **X-axis:** Model Size, labeled with values: 405M\*7B, 834M\*15B, 1.4B\*26B.
* **Y-axis (Main Chart):** Loss, ranging from approximately 2.1 to 2.7.
* **Y-axis (Subplot):** ΔLoss (Change in Loss), ranging from approximately 0 to 0.15.
* **Legend (Top-Right):**
* Blue Dashed Line: GPT fitted
* Orange Dashed Line: LLaMA fitted
* Blue Solid Line with Circle Markers: GPT
* Green Solid Line with Circle Markers: LLaMA
* Blue Solid Line with Star Markers: Pondering GPT
* Orange Solid Line with Star Markers: Pondering LLaMA
* **Text Annotations:** "2.01x" and "2.26x" are annotated on the chart, indicating relative scaling factors.
### Detailed Analysis or Content Details
**Main Chart:**
* **GPT (Blue Circles):** The line slopes downward, indicating decreasing loss with increasing model size.
* At 405M\*7B: Loss ≈ 2.62
* At 834M\*15B: Loss ≈ 2.38
* At 1.4B\*26B: Loss ≈ 2.23
* **LLaMA (Green Circles):** The line also slopes downward, but is generally above the GPT line.
* At 405M\*7B: Loss ≈ 2.52
* At 834M\*15B: Loss ≈ 2.32
* At 1.4B\*26B: Loss ≈ 2.18
* **Pondering GPT (Blue Stars):** The line slopes downward, starting above the GPT line and converging towards it at larger model sizes.
* At 405M\*7B: Loss ≈ 2.48
* At 834M\*15B: Loss ≈ 2.30
* At 1.4B\*26B: Loss ≈ 2.20
* **Pondering LLaMA (Orange Stars):** The line slopes downward, starting above the LLaMA line and converging towards it at larger model sizes.
* At 405M\*7B: Loss ≈ 2.43
* At 834M\*15B: Loss ≈ 2.26
* At 1.4B\*26B: Loss ≈ 2.15
* **Fitted Lines (Dashed):** The dashed lines represent the fitted curves for GPT (blue) and LLaMA (orange). They generally follow the trend of the corresponding solid lines.
**Subplot (ΔLoss):**
* L<sub>GPT</sub> (Black Dashed Line): Relatively flat, with a slight downward trend. ΔLoss ≈ 0.05 - 0.07
* L<sub>LLaMA</sub> (Black Solid Line with Triangle Markers): Relatively flat, with a slight downward trend. ΔLoss ≈ 0.05 - 0.08
* L<sub>PonderingGPT</sub> (Red Solid Line with Triangle Markers): Relatively flat, with a slight downward trend. ΔLoss ≈ 0.08 - 0.10
* L<sub>PonderingLLaMA</sub> (Orange Solid Line with Triangle Markers): Relatively flat, with a slight downward trend. ΔLoss ≈ 0.05 - 0.07
### Key Observations
* Both GPT and LLaMA exhibit decreasing loss as model size increases.
* GPT consistently has lower loss values than LLaMA across all model sizes.
* "Pondering" initially increases loss but appears to converge towards the non-pondering models as size increases.
* The ΔLoss subplot shows that the change in loss is relatively small across the tested model sizes for all configurations.
* The annotations "2.01x" and "2.26x" likely represent the scaling factor of loss reduction between model sizes for LLaMA and GPT respectively.
### Interpretation
The chart demonstrates the impact of model size on loss for GPT and LLaMA architectures, both with and without the "Pondering" mechanism. The consistent downward trend in loss for both models indicates that increasing model size generally improves performance (reduces loss). The lower loss values for GPT suggest that it is a more efficient model than LLaMA for the given task.
The "Pondering" mechanism appears to introduce a slight initial increase in loss, but its effect diminishes as the model size grows. This could indicate that "Pondering" is more beneficial for smaller models or requires larger models to fully realize its potential. The ΔLoss subplot confirms that the change in loss is relatively small, suggesting that the benefits of increasing model size may plateau beyond a certain point.
The annotations "2.01x" and "2.26x" provide a quantitative measure of the loss reduction achieved by increasing model size. These values suggest that GPT experiences a slightly larger reduction in loss per unit increase in model size compared to LLaMA.
The chart provides valuable insights into the trade-offs between model size, loss, and the effectiveness of the "Pondering" mechanism. This information can be used to guide the development and deployment of language models for specific applications.