## Line Graph: Model Performance Comparison Across Sizes
### Overview
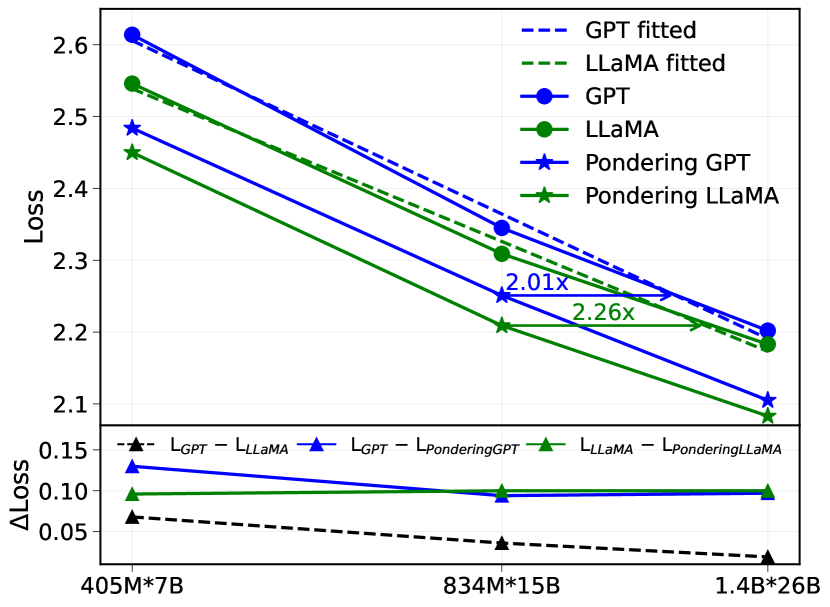
The image contains a dual-axis line graph comparing the performance of GPT and LLaMA models across three different sizes (405M*7B, 834M*15B, 1.4B*26B). The main chart shows loss values, while the lower subplot displays the difference in loss (ΔLoss) between model variants. The graph includes fitted lines, actual model performance, and pondering-adjusted models.
### Components/Axes
- **Main Chart**:
- **X-axis**: Model sizes (405M*7B, 834M*15B, 1.4B*26B)
- **Y-axis**: Loss (2.1–2.6)
- **Legend**:
- Dashed blue: GPT fitted
- Dashed green: LLaMA fitted
- Solid blue circles: GPT
- Solid green circles: LLaMA
- Solid blue stars: Pondering GPT
- Solid green stars: Pondering LLaMA
- **Annotations**:
- "2.01x" (834M*15B)
- "2.26x" (1.4B*26B)
- **Lower Subplot**:
- **X-axis**: Same model sizes
- **Y-axis**: ΔLoss (0.05–0.15)
- **Lines**:
- Blue: GPT - LLaMA
- Green: LLaMA - Pondering LLaMA
- Black dashed: L_GPT - L_LLaMA
### Detailed Analysis
1. **Main Chart Trends**:
- **GPT fitted (dashed blue)**: Starts at ~2.6 (405M*7B) and decreases to ~2.2 (1.4B*26B).
- **LLaMA fitted (dashed green)**: Starts at ~2.55 (405M*7B) and decreases to ~2.15 (1.4B*26B).
- **GPT (solid blue circles)**: Starts at ~2.5 (405M*7B) and decreases to ~2.2 (1.4B*26B).
- **LLaMA (solid green circles)**: Starts at ~2.45 (405M*7B) and decreases to ~2.15 (1.4B*26B).
- **Pondering GPT (blue stars)**: Starts at ~2.45 (405M*7B) and decreases to ~2.1 (1.4B*26B).
- **Pondering LLaMA (green stars)**: Starts at ~2.4 (405M*7B) and decreases to ~2.05 (1.4B*26B).
2. **Lower Subplot Trends**:
- **GPT - LLaMA (blue)**: ΔLoss ~0.12 (405M*7B) to ~0.08 (1.4B*26B).
- **LLaMA - Pondering LLaMA (green)**: ΔLoss ~0.08 (405M*7B) to ~0.05 (1.4B*26B).
- **L_GPT - L_LLaMA (black dashed)**: ΔLoss ~0.06 (405M*7B) to ~0.03 (1.4B*26B).
### Key Observations
1. **Fitted vs. Actual Models**:
- Fitted lines (dashed) are consistently higher than actual model lines (solid), suggesting overestimation or different evaluation criteria.
- Pondering models (stars) show lower loss than base models (circles), indicating performance improvement.
2. **Model Size Impact**:
- Loss decreases as model size increases for all variants.
- The ratio of GPT fitted to LLaMA fitted loss increases from 2.01x (834M*15B) to 2.26x (1.4B*26B), implying GPT's relative performance degrades more with larger models.
3. **ΔLoss Analysis**:
- GPT has a larger loss gap compared to LLaMA (blue line) than LLaMA compared to its pondering version (green line).
- The black dashed line (L_GPT - L_LLaMA) shows the smallest ΔLoss, suggesting minimal difference between GPT and LLaMA base models.
### Interpretation
- **Performance Trends**: Larger models generally perform better (lower loss), but the rate of improvement varies by model type. Pondering techniques reduce loss, with LLaMA showing a more significant reduction than GPT.
- **Fitted Line Discrepancy**: The fitted lines (dashed) being higher than actual models may indicate overfitting or a mismatch between training and evaluation data.
- **Ratio Increase**: The growing ratio of GPT to LLaMA fitted loss (2.01x → 2.26x) suggests GPT's performance becomes relatively worse as models scale, possibly due to architectural or training differences.
- **ΔLoss Implications**: The smaller ΔLoss in pondering LLaMA (green line) highlights its effectiveness in narrowing the performance gap between GPT and LLaMA. The black dashed line's minimal ΔLoss implies that base GPT and LLaMA models are closer in performance than their fitted counterparts.
This data underscores the importance of model architecture and optimization techniques (e.g., pondering) in balancing performance and scalability. The fitted lines' divergence from actual results warrants further investigation into evaluation methodologies.