## Line Chart: Number of Operations vs. Reasoning Steps
### Overview
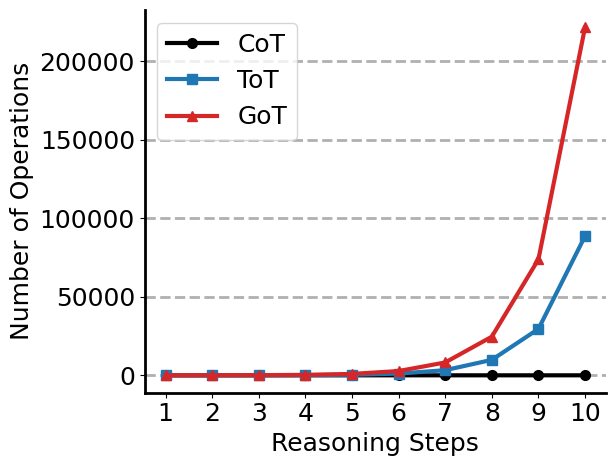
The image is a line chart comparing the computational cost, measured in "Number of Operations," of three different reasoning methods—CoT, ToT, and GoT—across an increasing number of "Reasoning Steps" from 1 to 10. The chart demonstrates a dramatic divergence in scalability, with one method showing exponential growth.
### Components/Axes
* **Chart Type:** Line chart with markers.
* **X-Axis (Horizontal):**
* **Label:** "Reasoning Steps"
* **Scale:** Linear, integer values from 1 to 10.
* **Y-Axis (Vertical):**
* **Label:** "Number of Operations"
* **Scale:** Linear, with major gridlines and labels at 0, 50,000, 100,000, 150,000, and 200,000.
* **Legend:** Located in the top-left corner of the plot area.
* **CoT:** Black line with solid circle markers.
* **ToT:** Blue line with solid square markers.
* **GoT:** Red line with solid triangle markers.
### Detailed Analysis
The chart plots three distinct data series:
1. **CoT (Black line, circle markers):**
* **Trend:** The line is essentially flat and horizontal, hovering very close to the x-axis (0 operations) across all 10 reasoning steps.
* **Data Points (Approximate):** The number of operations remains at or near 0 for steps 1 through 10.
2. **ToT (Blue line, square markers):**
* **Trend:** The line remains flat near zero for the first several steps, then begins a clear, accelerating upward curve starting around step 7.
* **Data Points (Approximate):**
* Steps 1-6: ~0 operations.
* Step 7: ~5,000 operations.
* Step 8: ~10,000 operations.
* Step 9: ~30,000 operations.
* Step 10: ~90,000 operations.
3. **GoT (Red line, triangle markers):**
* **Trend:** The line shows the most aggressive growth. It begins its upward curve earlier than ToT (around step 6) and rises much more steeply, exhibiting clear exponential growth.
* **Data Points (Approximate):**
* Steps 1-5: ~0 operations.
* Step 6: ~5,000 operations.
* Step 7: ~10,000 operations.
* Step 8: ~25,000 operations.
* Step 9: ~75,000 operations.
* Step 10: ~220,000 operations (exceeding the top gridline of 200,000).
### Key Observations
* **Divergence Point:** All three methods have negligible operational cost for the first 5-6 steps. The significant divergence begins at step 6 for GoT and step 7 for ToT.
* **Growth Magnitude:** At step 10, the operational cost of GoT is approximately 2.4 times that of ToT and orders of magnitude greater than CoT.
* **Scalability:** CoT appears to scale linearly or with very low constant cost. ToT scales super-linearly (likely polynomial or exponential). GoT scales with a very steep exponential curve.
* **Visual Confirmation:** The red triangle markers (GoT) are consistently above the blue square markers (ToT) from step 8 onward, and both are far above the black circle markers (CoT).
### Interpretation
This chart visually quantifies the trade-off between reasoning complexity and computational cost for different AI reasoning paradigms.
* **CoT (Chain-of-Thought):** Represents a simple, sequential reasoning process. Its flat line suggests it adds minimal operational overhead per step, making it highly efficient but potentially limited in problem-solving power.
* **ToT (Tree-of-Thought):** Represents a branching, exploratory reasoning process. The rising curve indicates that evaluating multiple branches at each step leads to a multiplicative increase in operations, becoming costly for deep reasoning chains.
* **GoT (Graph-of-Thought):** Represents a more complex reasoning process where thoughts can form interconnected graphs (allowing for merging, cycling, and more complex structures than a tree). The steep exponential rise suggests this flexibility comes at an extreme computational price, potentially limiting its practical application to problems requiring only a few reasoning steps unless optimized.
The data suggests that while more sophisticated reasoning frameworks (ToT, GoT) may offer superior problem-solving capabilities, they face a severe scalability challenge. The "Number of Operations" serves as a proxy for time, memory, or cost, implying that for tasks requiring deep reasoning (many steps), CoT may be the only feasible approach without significant algorithmic or hardware improvements. The chart argues for the necessity of research into pruning, heuristic guidance, or approximate methods to make advanced reasoning frameworks like GoT practical.