## Scatter Plot: Relative Attention Computation Output Error vs Unbalance Factor
### Overview
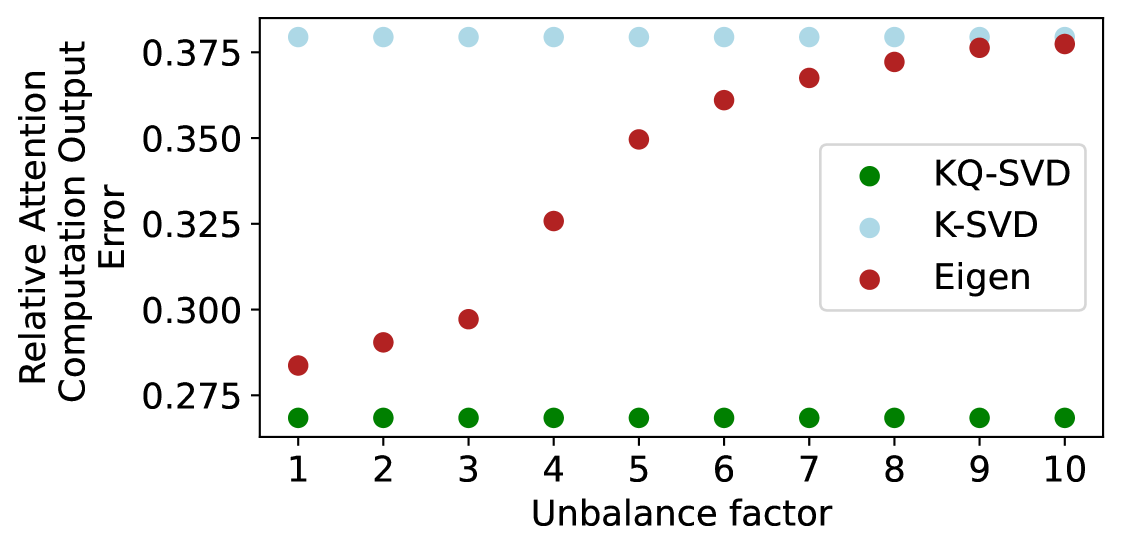
The image is a scatter plot comparing three algorithms (KQ-SVD, K-SVD, Eigen) across an unbalance factor range (1-10). The y-axis measures relative computation output error, while the x-axis represents the unbalance factor. Three distinct data series are plotted with different colors and markers.
### Components/Axes
- **X-axis**: Unbalance factor (integer values 1-10, labeled "Unbalance factor")
- **Y-axis**: Relative Attention Computation Output Error (continuous scale from 0.275 to 0.375)
- **Legend**: Located in the top-right corner, with:
- Green circles: KQ-SVD
- Blue circles: K-SVD
- Red circles: Eigen
- **Data Points**:
- KQ-SVD (green): 10 points at y=0.275 across all x-values
- K-SVD (blue): 10 points at y=0.375 across all x-values
- Eigen (red): 10 points showing a linear increase from y=0.28 (x=1) to y=0.38 (x=10)
### Detailed Analysis
1. **KQ-SVD (Green)**:
- All 10 data points cluster at y=0.275
- No variation across unbalance factors
- Spatial pattern: Horizontal line at bottom of plot
2. **K-SVD (Blue)**:
- All 10 data points cluster at y=0.375
- No variation across unbalance factors
- Spatial pattern: Horizontal line at top of plot
3. **Eigen (Red)**:
- Linear progression from (1, 0.28) to (10, 0.38)
- Each subsequent point increases by ~0.01 in error
- Spatial pattern: Diagonal upward trend from bottom-left to top-right
### Key Observations
- KQ-SVD demonstrates perfect stability (zero error variation)
- K-SVD shows maximum error but no sensitivity to unbalance
- Eigen exhibits predictable error growth (0.01 error per unbalance factor unit)
- All algorithms maintain consistent performance within their respective error ranges
- No overlapping data points between series
### Interpretation
The plot reveals fundamental differences in algorithmic behavior:
1. **KQ-SVD** appears most efficient, maintaining minimal error regardless of unbalance
2. **K-SVD** consistently underperforms with highest error but shows no degradation
3. **Eigen**'s error increases linearly with unbalance, suggesting potential scalability issues
4. The 0.1 error difference between KQ-SVD and K-SVD indicates significant performance disparity
5. Eigen's predictable error growth could enable error compensation strategies
The data suggests KQ-SVD is optimal for unbalanced scenarios, while Eigen's performance degradation might require mitigation techniques for high-unbalance applications.