# Technical Document Extraction: Perplexity vs. Context Size Chart
## 1. Image Overview
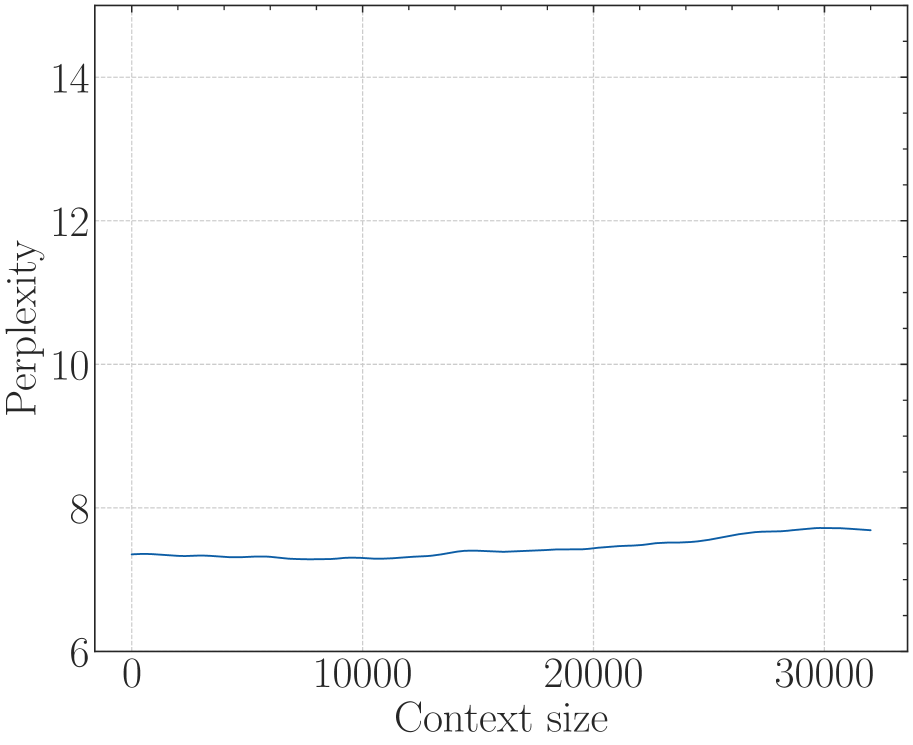
This image is a line graph illustrating the relationship between "Perplexity" and "Context size" for a computational model (likely a Large Language Model). The chart uses a clean, academic style with a serif font and a light gray grid.
## 2. Component Isolation
### Header/Title
* **Content:** None present.
### Main Chart Area
* **Type:** Line Graph.
* **Background:** White with a light gray dashed grid.
* **Grid Lines:** Vertical grid lines occur every 10,000 units on the x-axis. Horizontal grid lines occur every 2 units on the y-axis.
### Axis Labels and Markers
* **Y-Axis (Vertical):**
* **Label:** "Perplexity" (oriented vertically).
* **Scale:** 6 to 14.
* **Major Tick Marks:** 6, 8, 10, 12, 14.
* **Minor Tick Marks:** Present between major intervals (representing increments of 1).
* **X-Axis (Horizontal):**
* **Label:** "Context size".
* **Scale:** 0 to 30,000+.
* **Major Tick Marks:** 0, 10000, 20000, 30000.
* **Minor Tick Marks:** Present at intervals of 2,500 units.
### Legend
* **Location:** Not present. There is only a single data series.
---
## 3. Data Series Analysis
### Series 1: Perplexity Performance
* **Color:** Dark Blue.
* **Trend Verification:** The line begins at a low perplexity value and remains remarkably stable. It exhibits a very slight downward dip in the first third of the graph, followed by a very gradual upward slope as the context size increases toward 32,000. The overall trend is "near-horizontal stability," indicating the model maintains consistent performance across varying context lengths.
### Estimated Data Points
Based on the grid alignment:
| Context Size (x) | Perplexity (y) | Notes |
| :--- | :--- | :--- |
| 0 | ~7.4 | Starting point. |
| 5,000 | ~7.3 | Slight decrease/dip. |
| 10,000 | ~7.3 | Local minimum. |
| 15,000 | ~7.4 | Returning to baseline. |
| 20,000 | ~7.5 | Very gradual increase. |
| 25,000 | ~7.6 | Continued gradual increase. |
| 30,000 | ~7.7 | Peak perplexity in this range. |
| 32,000 | ~7.7 | Final data point, slight plateau. |
---
## 4. Technical Summary
The chart demonstrates the model's ability to handle long-range dependencies. In many language models, perplexity (a measure of uncertainty) tends to spike or degrade significantly as context size increases. This specific data shows a highly robust model where perplexity remains within a very narrow band (approximately 7.3 to 7.7) even as the context size scales from 0 to over 30,000 tokens. This suggests effective architectural scaling or the use of techniques like RoPE (Rotary Positional Embeddings) or Alibi that mitigate performance loss at high context lengths.