# Chart Analysis: Perplexity vs. Token Seen Across LLaMA Model Sizes
## Chart 1: LLaMA-130M
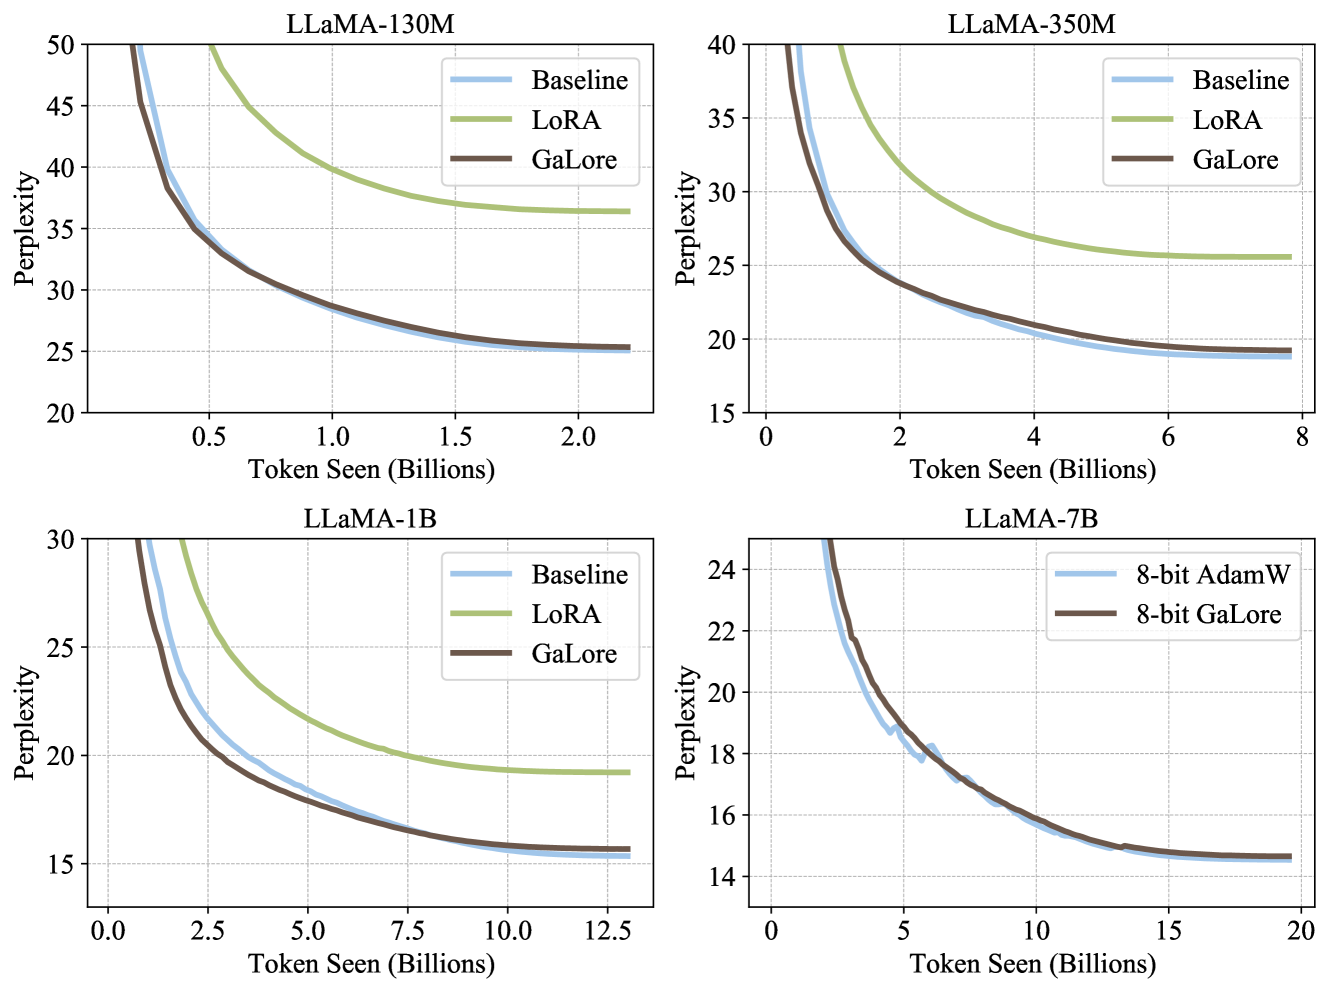
- **Title**: LLaMA-130M
- **Y-Axis**: Perplexity (Range: 20–50)
- **X-Axis**: Token Seen (Billions) (Range: 0–2.5)
- **Legend**:
- **Baseline**: Blue line
- **LoRA**: Green line
- **GaLore**: Brown line
- **Key Trends**:
- All models show decreasing perplexity as token count increases.
- **LoRA** (green) consistently outperforms Baseline and GaLore across all token ranges.
- **GaLore** (brown) closely follows Baseline (blue) but slightly outperforms it.
- Baseline (blue) shows the slowest decline in perplexity.
## Chart 2: LLaMA-350M
- **Title**: LLaMA-350M
- **Y-Axis**: Perplexity (Range: 15–40)
- **X-Axis**: Token Seen (Billions) (Range: 0–8)
- **Legend**:
- **Baseline**: Blue line
- **LoRA**: Green line
- **GaLore**: Brown line
- **Key Trends**:
- Similar to LLaMA-130M, **LoRA** (green) achieves the lowest perplexity.
- **GaLore** (brown) and Baseline (blue) converge at higher token counts (~6B+).
- Perplexity declines more sharply for LoRA compared to other methods.
## Chart 3: LLaMA-1B
- **Title**: LLaMA-1B
- **Y-Axis**: Perplexity (Range: 15–30)
- **X-Axis**: Token Seen (Billions) (Range: 0–12.5)
- **Legend**:
- **Baseline**: Blue line
- **LoRA**: Green line
- **GaLore**: Brown line
- **Key Trends**:
- **LoRA** (green) maintains the steepest decline in perplexity.
- **GaLore** (brown) and Baseline (blue) show similar performance, with Baseline slightly outperforming GaLore at lower token counts (~2.5B).
- All methods plateau at ~15 perplexity as token count approaches 12.5B.
## Chart 4: LLaMA-7B
- **Title**: LLaMA-7B
- **Y-Axis**: Perplexity (Range: 14–24)
- **X-Axis**: Token Seen (Billions) (Range: 0–20)
- **Legend**:
- **8-bit AdamW**: Blue line
- **8-bit GaLore**: Brown line
- **Key Trends**:
- **8-bit GaLore** (brown) outperforms **8-bit AdamW** (blue) across all token ranges.
- Both methods show a sharp decline in perplexity up to ~5B tokens, then plateau.
- Perplexity for both methods converges near 16 at 20B tokens.
## Cross-Chart Observations
1. **Model Size Impact**:
- Larger models (e.g., LLaMA-7B) achieve lower perplexity at equivalent token counts compared to smaller models (e.g., LLaMA-130M).
- LoRA consistently outperforms other methods across all model sizes.
2. **Quantization Effects**:
- In LLaMA-7B, 8-bit quantization (AdamW vs. GaLore) shows minimal performance gap (~2 perplexity units) compared to full-precision models in smaller sizes.
3. **Scalability**:
- All methods exhibit diminishing returns in perplexity reduction as token counts exceed 5–10B, depending on model size.
## Technical Notes
- **Baseline**: Represents standard training without parameter-efficient fine-tuning (PEFT).
- **LoRA**: Low-Rank Adaptation, a PEFT method that freezes base model weights and trains low-rank matrices.
- **GaLore**: Gradient-based Low-Rank Adaptation, a variant of LoRA with gradient-based rank selection.
- **8-bit AdamW/GaLore**: Quantized training methods for reduced memory usage.