# Technical Document Extraction: Network Traffic Frequency Analysis
## 1. Image Overview
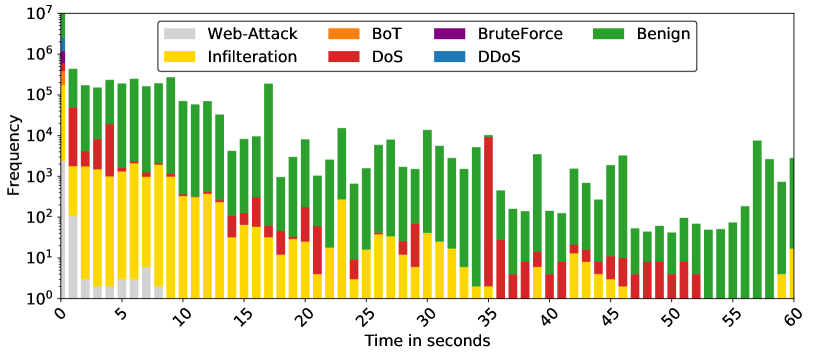
This image is a stacked bar chart representing the frequency of different types of network traffic (Benign and various Attack types) over a duration of 60 seconds. The Y-axis uses a logarithmic scale to accommodate a wide range of frequency values, from $10^0$ to $10^7$.
## 2. Component Isolation
### A. Header / Legend
* **Location:** Top center, enclosed in a rounded rectangle.
* **Content:** Seven categories of network traffic, each associated with a specific color.
1. **Web-Attack:** Light Grey
2. **Infiltration:** Yellow
3. **BoT:** Orange
4. **DoS:** Red
5. **BruteForce:** Purple
6. **DDoS:** Blue
7. **Benign:** Green
### B. Main Chart Area (Axes)
* **Y-Axis (Vertical):**
* **Label:** "Frequency"
* **Scale:** Logarithmic, ranging from $10^0$ (1) to $10^7$ (10,000,000).
* **Major Markers:** $10^0, 10^1, 10^2, 10^3, 10^4, 10^5, 10^6, 10^7$.
* **X-Axis (Horizontal):**
* **Label:** "Time in seconds"
* **Range:** 0 to 60 seconds.
* **Major Markers:** 0, 5, 10, 15, 20, 25, 30, 35, 40, 45, 50, 55, 60.
* **Note:** The labels are rotated approximately 45 degrees for readability.
## 3. Data Series Analysis and Trends
### Benign (Green)
* **Trend:** This is the most consistent and dominant category across the entire 60-second window. It maintains a high frequency, generally fluctuating between $10^3$ and $10^5$.
* **Peak:** Reaches its highest point at $t=0$, exceeding $10^6$.
### Infiltration (Yellow)
* **Trend:** Highly active in the first 15 seconds, then gradually tapers off. It remains present in smaller quantities (between $10^0$ and $10^2$) throughout most of the timeline, with a slight resurgence around $t=30$.
* **Initial Volume:** Starts strong between $10^3$ and $10^4$ in the first 10 seconds.
### DoS (Red)
* **Trend:** Appears sporadically. Notable bursts occur at $t=1$ to $t=4$, $t=14$ to $t=22$, and a significant spike at $t=35$.
* **Significant Event:** At $t=35$, DoS traffic spikes sharply to nearly $10^4$, briefly becoming the dominant attack type.
### Web-Attack (Light Grey)
* **Trend:** Only present at the very beginning of the capture.
* **Duration:** Visible from $t=0$ to approximately $t=8$.
* **Volume:** Starts at $10^2$ at $t=0$ and drops below $10^1$ quickly.
### DDoS (Blue), BruteForce (Purple), and BoT (Orange)
* **Trend:** These categories are only visible as very thin slivers at the $t=0$ mark.
* **Observation:** Due to the logarithmic scale and the massive volume of Benign traffic at $t=0$, these categories are effectively negligible for the remainder of the 60-second period shown.
## 4. Key Data Observations
* **Initial Burst:** At $t=0$, there is a massive accumulation of all traffic types, with Benign traffic peaking at nearly $10^7$.
* **Attack Composition:** For the first 10 seconds, the primary "attack" traffic is a combination of Infiltration and Web-Attack.
* **Mid-Capture Shift:** Between 35 and 45 seconds, the "Infiltration" traffic almost disappears, replaced by intermittent "DoS" (Red) activity.
* **End of Capture:** From 53 to 58 seconds, the traffic is almost exclusively "Benign" (Green), with a small amount of "Infiltration" (Yellow) reappearing at $t=60$.