# Technical Document Analysis of Network Traffic Frequency Chart
## Chart Overview
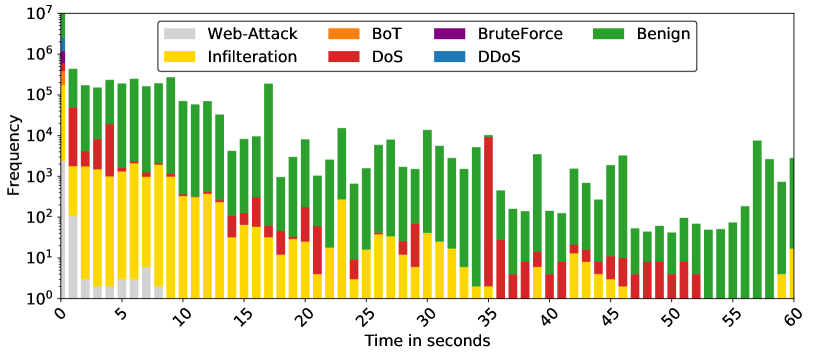
The image is a **stacked bar chart** visualizing the frequency distribution of network traffic types over time. The chart uses a **logarithmic y-axis** (frequency) and a **linear x-axis** (time in seconds). Key components include:
---
### **Axis Labels and Markers**
- **X-axis**: "Time in seconds" with markers at intervals of 5 seconds (0, 5, 10, ..., 60).
- **Y-axis**: "Frequency" with logarithmic scale markers: 10⁰, 10¹, 10², ..., 10⁷.
---
### **Legend and Categories**
The legend (top-right corner) defines seven traffic types with color-coded segments:
1. **Web-Attack** (gray)
2. **Bot** (orange)
3. **BruteForce** (purple)
4. **Benign** (green)
5. **Infiltration** (yellow)
6. **DoS** (red)
7. **DDoS** (blue)
---
### **Data Structure**
Each bar represents a 5-second interval (e.g., 0–5s, 5–10s, etc.). Bars are segmented vertically by traffic type, with heights proportional to frequency on the logarithmic scale.
---
### **Key Trends and Data Points**
1. **Benign Traffic (Green)**:
- Dominates all intervals, consistently occupying the largest portion of bars.
- Peaks at **~10⁶ frequency** around **20–25 seconds**.
- Declines slightly after 30 seconds but remains the most frequent category.
2. **Web-Attack (Gray)**:
- Only present in the **first 5 seconds** (0–5s interval).
- Frequency: ~10² (100) at 0s, dropping to ~10¹ (10) by 5s.
3. **Bot Traffic (Orange)**:
- Peaks at **~10⁵ frequency** around **10 seconds**.
- Gradual decline after 15 seconds, with minimal presence after 30s.
4. **Infiltration (Yellow)**:
- Highest frequency in **0–10s** (~10⁵).
- Sharp decline after 15s, with sporadic low-level activity thereafter.
5. **DoS (Red)**:
- Minimal until **35 seconds**, then spikes to **~10⁵ frequency**.
- Declines sharply after 40s.
6. **BruteForce (Purple)** and **DDoS (Blue)**:
- Both categories show **negligible frequency** (<10²) across all intervals.
---
### **Spatial Grounding**
- **Legend Position**: Top-right corner, aligned with the chart's upper boundary.
- **Color Consistency**: All segments match legend colors (e.g., green = Benign, red = DoS).
---
### **Trend Verification**
- **Benign**: Steady high frequency, logarithmic scale emphasizes dominance.
- **Web-Attack**: Sudden drop-off after 5s confirms short-lived attack.
- **Bot/Infiltration**: Early peaks align with initial attack phases.
- **DoS**: Late emergence (35s) suggests delayed or targeted attack.
---
### **Conclusion**
The chart reveals a dynamic network traffic profile, with **Benign traffic** as the baseline and **DoS** as the most impactful late-stage anomaly. Early intervals show mixed attack activity (Web-Attack, Bot, Infiltration), while later intervals highlight DoS as the primary threat.
*Note: No non-English text or embedded tables were present.*