## Chart Type: Multiple Line Charts with Uncertainty Bands
### Overview
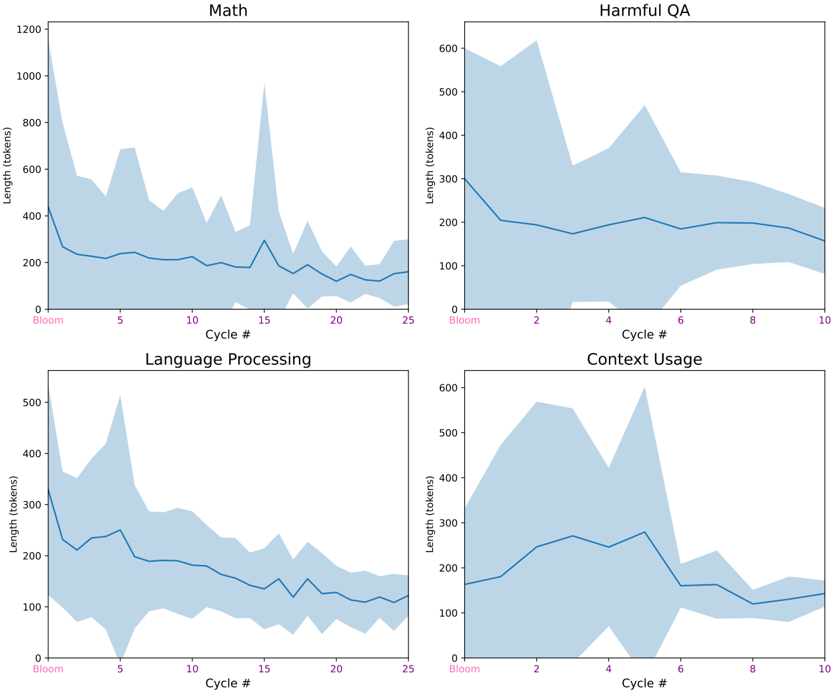
The image presents four line charts, each displaying the trend of "Length (tokens)" over "Cycle #". Each chart represents a different category: "Math", "Harmful QA", "Language Processing", and "Context Usage". The charts include a blue line indicating the average length, surrounded by a shaded blue area representing the uncertainty or variance around that average.
### Components/Axes
* **Titles:** Each chart has a title indicating the category: "Math" (top-left), "Harmful QA" (top-right), "Language Processing" (bottom-left), and "Context Usage" (bottom-right).
* **X-axis:** Labeled "Cycle #". The "Math" and "Language Processing" charts range from 0 to 25, with markers at 0 (labeled "Bloom"), 5, 10, 15, 20, and 25. The "Harmful QA" and "Context Usage" charts range from 0 to 10, with markers at 0 (labeled "Bloom"), 2, 4, 6, 8, and 10.
* **Y-axis:** Labeled "Length (tokens)". The "Math" chart ranges from 0 to 1200, with markers at 200, 400, 600, 800, 1000, and 1200. The other three charts ("Harmful QA", "Language Processing", and "Context Usage") range from 0 to 600, with markers at 100, 200, 300, 400, 500, and 600.
* **Data Series:** Each chart contains a single data series represented by a blue line and a shaded blue area around the line. The blue line represents the average length in tokens, and the shaded area represents the uncertainty or variance.
### Detailed Analysis
**1. Math Chart (Top-Left)**
* **Trend:** The length starts high and decreases sharply initially, then fluctuates around a lower average with a spike around cycle 15.
* **Data Points:**
* Cycle 0 (Bloom): Approximately 300 tokens.
* Cycle 5: Approximately 250 tokens.
* Cycle 10: Approximately 200 tokens.
* Cycle 15: Approximately 300 tokens, with a spike up to approximately 1000 tokens within the uncertainty band.
* Cycle 20: Approximately 150 tokens.
* Cycle 25: Approximately 150 tokens.
* **Uncertainty:** The uncertainty band is wide initially, narrows down, widens around cycle 15, and then narrows again.
**2. Harmful QA Chart (Top-Right)**
* **Trend:** The length decreases sharply initially, then stabilizes around a lower average.
* **Data Points:**
* Cycle 0 (Bloom): Approximately 250 tokens.
* Cycle 2: Approximately 200 tokens.
* Cycle 4: Approximately 200 tokens.
* Cycle 6: Approximately 220 tokens.
* Cycle 8: Approximately 200 tokens.
* Cycle 10: Approximately 180 tokens.
* **Uncertainty:** The uncertainty band is wide initially and narrows down over time.
**3. Language Processing Chart (Bottom-Left)**
* **Trend:** The length decreases sharply initially, then gradually decreases further.
* **Data Points:**
* Cycle 0 (Bloom): Approximately 250 tokens.
* Cycle 5: Approximately 220 tokens.
* Cycle 10: Approximately 180 tokens.
* Cycle 15: Approximately 150 tokens.
* Cycle 20: Approximately 120 tokens.
* Cycle 25: Approximately 100 tokens.
* **Uncertainty:** The uncertainty band is wide initially and narrows down over time.
**4. Context Usage Chart (Bottom-Right)**
* **Trend:** The length fluctuates, with a peak around cycle 4, then decreases and stabilizes.
* **Data Points:**
* Cycle 0 (Bloom): Approximately 250 tokens.
* Cycle 2: Approximately 250 tokens.
* Cycle 4: Approximately 280 tokens, with a peak up to approximately 550 tokens within the uncertainty band.
* Cycle 6: Approximately 180 tokens.
* Cycle 8: Approximately 150 tokens.
* Cycle 10: Approximately 150 tokens.
* **Uncertainty:** The uncertainty band is wide initially, narrows down, and then widens slightly again.
### Key Observations
* All four categories show an initial decrease in the length of tokens over cycles.
* The "Math" category has a notable spike in length around cycle 15.
* The "Harmful QA" and "Language Processing" categories show a more consistent decrease over time.
* The "Context Usage" category shows more fluctuation than the other categories.
* The uncertainty bands generally narrow down over time, suggesting that the variance in length decreases as the cycles progress.
### Interpretation
The charts suggest that, in general, the length of tokens required for these tasks tends to decrease over time (cycles). This could indicate that the model is learning to perform the tasks more efficiently, requiring fewer tokens. The spike in the "Math" category around cycle 15 could be due to a specific type of problem or a change in the task's complexity. The wider uncertainty bands at the beginning of the cycles suggest that the model's performance is more variable initially, and it becomes more consistent as it learns. The differences in trends between the categories likely reflect the different characteristics and complexities of each task.