## Line Charts: Length of Generated Text Across Cycles
### Overview
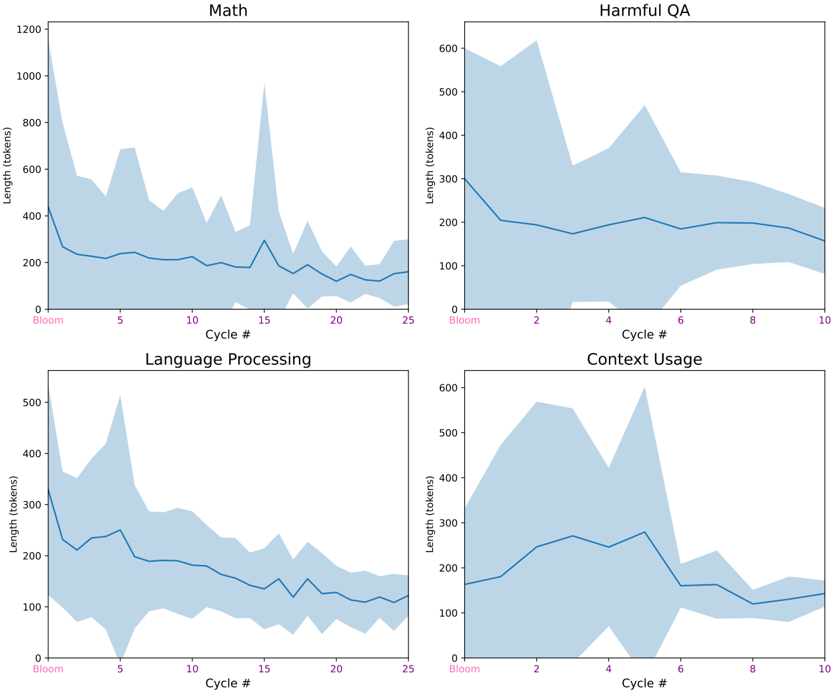
The image presents four separate line charts, each depicting the length of generated text (in tokens) as a function of "Cycle #". Each chart focuses on a different task: Math, Harmful QA, Language Processing, and Context Usage. All charts share a similar visual style, with a blue line representing the average length and a shaded blue area representing the variance or confidence interval around that average. The x-axis represents "Cycle #", and the y-axis represents "Length (tokens)".
### Components/Axes
* **X-axis (all charts):** "Cycle #" ranging from 0 to approximately 25 for Math and Language Processing, and 0 to 10 for Harmful QA and Context Usage.
* **Y-axis (all charts):** "Length (tokens)" ranging from 0 to 1200 for Math, 0 to 600 for Harmful QA, 0 to 500 for Language Processing, and 0 to 600 for Context Usage.
* **Line (all charts):** A solid blue line representing the average length of generated text.
* **Shaded Area (all charts):** A light blue shaded area representing the variance or confidence interval around the average length.
* **Titles (all charts):** Each chart has a title indicating the task being evaluated: "Math", "Harmful QA", "Language Processing", and "Context Usage".
### Detailed Analysis or Content Details
**1. Math:**
* **Trend:** The line starts at approximately 300 tokens at Cycle #0, initially decreases to a minimum of around 150 tokens at Cycle #5, then increases with significant fluctuations, peaking at approximately 1000 tokens around Cycle #15, and finally decreasing to around 200 tokens at Cycle #25.
* **Data Points (approximate):**
* Cycle #0: 300 tokens
* Cycle #5: 150 tokens
* Cycle #10: 400 tokens
* Cycle #15: 1000 tokens
* Cycle #20: 300 tokens
* Cycle #25: 200 tokens
**2. Harmful QA:**
* **Trend:** The line starts at approximately 400 tokens at Cycle #0, increases to a peak of around 600 tokens at Cycle #2, then decreases to approximately 200 tokens at Cycle #10.
* **Data Points (approximate):**
* Cycle #0: 400 tokens
* Cycle #2: 600 tokens
* Cycle #4: 400 tokens
* Cycle #6: 300 tokens
* Cycle #8: 250 tokens
* Cycle #10: 200 tokens
**3. Language Processing:**
* **Trend:** The line starts at approximately 300 tokens at Cycle #0, decreases to a minimum of around 100 tokens at Cycle #5, then increases with fluctuations, peaking at around 450 tokens at Cycle #15, and finally decreasing to approximately 200 tokens at Cycle #25.
* **Data Points (approximate):**
* Cycle #0: 300 tokens
* Cycle #5: 100 tokens
* Cycle #10: 250 tokens
* Cycle #15: 450 tokens
* Cycle #20: 300 tokens
* Cycle #25: 200 tokens
**4. Context Usage:**
* **Trend:** The line starts at approximately 300 tokens at Cycle #0, increases to a peak of around 500 tokens at Cycle #2, then decreases with fluctuations to approximately 200 tokens at Cycle #10.
* **Data Points (approximate):**
* Cycle #0: 300 tokens
* Cycle #2: 500 tokens
* Cycle #4: 350 tokens
* Cycle #6: 250 tokens
* Cycle #8: 200 tokens
* Cycle #10: 200 tokens
### Key Observations
* The "Math" task exhibits the most significant fluctuations in generated text length, with a large peak around Cycle #15.
* "Harmful QA" and "Context Usage" show a relatively consistent downward trend in text length over the observed cycles.
* "Language Processing" follows a similar pattern to "Math" but with lower overall text lengths and less extreme fluctuations.
* All tasks show an initial decrease in text length in the early cycles (0-5).
### Interpretation
The charts suggest that the length of generated text varies considerably depending on the task. The large fluctuations in the "Math" task could indicate a more complex generation process or a greater sensitivity to the cycle number. The decreasing trend in "Harmful QA" and "Context Usage" might suggest that the model is becoming more concise or focused in its responses as the cycles progress. The initial decrease in text length across all tasks could be due to a warm-up period where the model is learning to generate appropriate responses. The shaded areas indicate the variability in the generated text length, which could be due to factors such as randomness in the generation process or differences in the input data. The data suggests that the model's behavior is not static and evolves over the course of the cycles, with different tasks exhibiting different patterns of change. The differences in the length of generated text across tasks could also reflect the inherent complexity of each task.