## Line Graphs: Token Length Trends Across Tasks
### Overview
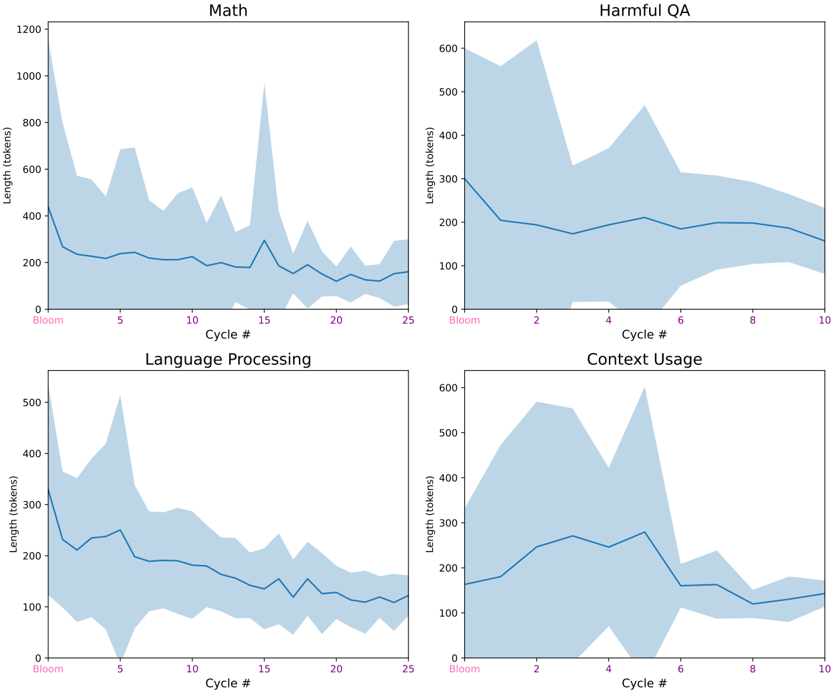
The image contains four line graphs arranged in a 2x2 grid, each visualizing the relationship between "Cycle #" (x-axis) and "Length (tokens)" (y-axis) for different tasks: Math, Harmful QA, Language Processing, and Context Usage. Each graph includes a shaded region representing variability in token length measurements.
### Components/Axes
- **X-axis (Cycle #):**
- Math: 0 to 25 (increments of 5)
- Harmful QA: 0 to 10 (increments of 2)
- Language Processing: 0 to 25 (increments of 5)
- Context Usage: 0 to 10 (increments of 2)
- **Y-axis (Length (tokens)):**
- Math: 0 to 1200
- Harmful QA: 0 to 600
- Language Processing: 0 to 500
- Context Usage: 0 to 600
- **Legend:** Located in the top-left corner, associating colors with tasks (e.g., blue for Math, purple for Harmful QA, etc.).
- **Shaded Region:** Represents variability in token length measurements for each task.
### Detailed Analysis
#### Math
- **Trend:** Starts at ~1200 tokens, drops sharply to ~200 tokens by Cycle 5, then fluctuates with peaks (e.g., ~800 tokens at Cycle 15) and troughs (e.g., ~100 tokens at Cycle 20).
- **Variability:** Wide initially (1200–200 range), narrowing to ~100–300 tokens by Cycle 25.
#### Harmful QA
- **Trend:** Begins at ~600 tokens, drops to ~200 tokens by Cycle 4, then fluctuates between ~150–500 tokens, peaking at ~500 tokens around Cycle 6.
- **Variability:** Narrows to ~100–300 tokens by Cycle 10.
#### Language Processing
- **Trend:** Starts at ~500 tokens, drops to ~100 tokens by Cycle 5, then fluctuates between ~50–300 tokens, with a peak of ~400 tokens at Cycle 5.
- **Variability:** Reduces to ~50–200 tokens by Cycle 25.
#### Context Usage
- **Trend:** Begins at ~400 tokens, drops to ~100 tokens by Cycle 4, then fluctuates between ~50–500 tokens, peaking at ~500 tokens around Cycle 4.
- **Variability:** Narrows to ~50–300 tokens by Cycle 10.
### Key Observations
1. **Initial Drop:** All tasks show a sharp decline in token length within the first 5–10 cycles.
2. **Stabilization:** After the initial drop, token lengths stabilize but exhibit cyclical fluctuations.
3. **Peaks:** Math and Context Usage show the highest peaks (~800 and ~500 tokens, respectively), while Harmful QA and Language Processing have lower peaks (~500 and ~400 tokens).
4. **Variability:** The shaded regions indicate decreasing consistency over cycles, with Math and Language Processing showing the most variability.
### Interpretation
The data suggests that token length decreases significantly during the early cycles for all tasks, likely reflecting optimization or efficiency gains. Subsequent fluctuations imply task-specific variability in processing demands. Math and Context Usage exhibit the highest initial and peak token lengths, possibly due to complex computations or contextual dependencies. The narrowing shaded regions over time indicate improved stability in token usage as cycles progress. These trends could reflect algorithmic adjustments, data preprocessing changes, or task-specific resource allocation patterns.