## Radar Chart: Performance Comparison of Algorithms
### Overview
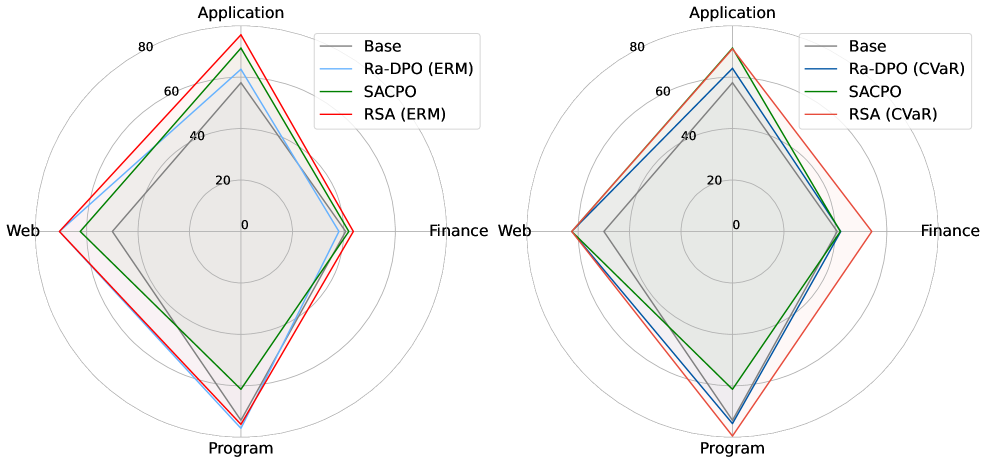
The image presents two radar charts comparing the performance of different algorithms across four categories: Application, Finance, Program, and Web. The left chart compares "Base", "Ra-DPO (ERM)", "SACPO", and "RSA (ERM)", while the right chart compares "Base", "Ra-DPO (CVaR)", "SACPO", and "RSA (CVaR)". The charts use a radial scale from 0 to 80 to represent performance.
### Components/Axes
* **Chart Type**: Radar Chart
* **Number of Charts**: 2
* **Axes**: Four radial axes representing the categories: Application, Finance, Program, and Web.
* **Scale**: The radial scale ranges from 0 to 80, with concentric circles marking increments of 20.
* **Legend (Left Chart)**: Located at the top-center of the left chart.
* Base (Gray)
* Ra-DPO (ERM) (Light Blue)
* SACPO (Green)
* RSA (ERM) (Red)
* **Legend (Right Chart)**: Located at the top-center of the right chart.
* Base (Gray)
* Ra-DPO (CVaR) (Dark Blue)
* SACPO (Green)
* RSA (CVaR) (Red)
### Detailed Analysis or ### Content Details
**Left Chart (ERM)**:
* **Base (Gray)**: Performance is approximately 65 for Application, 40 for Finance, 10 for Program, and 40 for Web.
* **Ra-DPO (ERM) (Light Blue)**: Performance is approximately 75 for Application, 40 for Finance, 10 for Program, and 40 for Web.
* **SACPO (Green)**: Performance is approximately 70 for Application, 40 for Finance, 10 for Program, and 40 for Web.
* **RSA (ERM) (Red)**: Performance is approximately 60 for Application, 40 for Finance, 10 for Program, and 40 for Web.
**Right Chart (CVaR)**:
* **Base (Gray)**: Performance is approximately 65 for Application, 40 for Finance, 10 for Program, and 40 for Web.
* **Ra-DPO (CVaR) (Dark Blue)**: Performance is approximately 70 for Application, 40 for Finance, 10 for Program, and 40 for Web.
* **SACPO (Green)**: Performance is approximately 70 for Application, 40 for Finance, 10 for Program, and 40 for Web.
* **RSA (CVaR) (Red)**: Performance is approximately 60 for Application, 40 for Finance, 10 for Program, and 40 for Web.
### Key Observations
* **Application**: All algorithms perform relatively well in the Application category, with Ra-DPO (ERM) showing the highest performance in the left chart and Ra-DPO (CVaR) showing the highest performance in the right chart.
* **Finance**: All algorithms have similar performance in the Finance category, around 40.
* **Program**: All algorithms perform poorly in the Program category, close to 0.
* **Web**: All algorithms have similar performance in the Web category, around 40.
* **Comparison between ERM and CVaR**: The performance of SACPO is identical in both charts. The performance of RSA is identical in both charts. The performance of Ra-DPO is slightly higher in the ERM chart than in the CVaR chart.
### Interpretation
The radar charts provide a visual comparison of the performance of different algorithms across four categories. The charts suggest that all algorithms perform well in the Application category but struggle in the Program category. The performance in Finance and Web categories is moderate and similar across all algorithms. The comparison between ERM and CVaR variants of Ra-DPO and RSA shows that the ERM variant of Ra-DPO performs slightly better than the CVaR variant. The performance of SACPO is identical in both charts. The performance of RSA is identical in both charts.