\n
## Bar Chart: Types of Errors Made by a 62B Language Model
### Overview
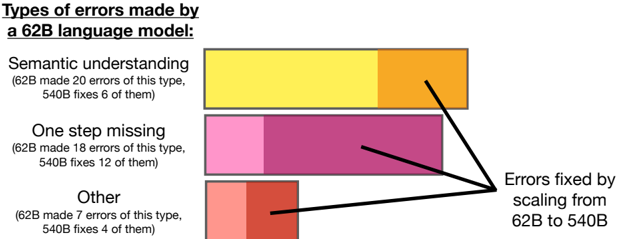
This image presents a bar chart illustrating the types of errors made by a 62B language model, and how many of those errors were fixed by scaling the model to 540B parameters. The chart uses horizontal bars to represent the number of errors for each error type.
### Components/Axes
* **Title:** "Types of errors made by a 62B language model:" (Top-left)
* **Error Types (Y-axis):**
* Semantic understanding
* One step missing
* Other
* **Error Count (Implied X-axis):** The length of the bars represents the number of errors.
* **Data Labels:** Each bar has associated text indicating the number of errors made by the 62B model and the number of errors fixed by scaling to 540B.
* **Annotation:** "Errors fixed by scaling from 62B to 540B" with an arrow pointing from each bar to the end of the arrow.
### Detailed Analysis
* **Semantic Understanding:**
* 62B model made approximately 20 errors of this type.
* 540B model fixed approximately 6 of these errors.
* Bar color: Yellow
* **One Step Missing:**
* 62B model made approximately 18 errors of this type.
* 540B model fixed approximately 12 of these errors.
* Bar color: Pink/Magenta
* **Other:**
* 62B model made approximately 7 errors of this type.
* 540B model fixed approximately 4 of these errors.
* Bar color: Red/Orange
### Key Observations
* The "Semantic understanding" category has the highest number of errors in the 62B model (20 errors).
* The "One step missing" category has the second highest number of errors (18 errors).
* The "Other" category has the lowest number of errors (7 errors).
* The 540B model fixed a substantial portion of the errors in each category, with the highest number of fixes in the "One step missing" category (12 errors).
* The proportion of errors fixed is highest for "One step missing" (12/18 ≈ 67%) and lowest for "Semantic understanding" (6/20 = 30%).
### Interpretation
The data suggests that scaling the language model from 62B to 540B parameters significantly reduces the number of errors across all identified error types. The "One step missing" errors appear to be the most susceptible to correction through scaling, while "Semantic understanding" errors are more persistent. This could indicate that "One step missing" errors are more related to model capacity, while "Semantic understanding" errors may require more fundamental architectural improvements or training data enhancements. The chart highlights the benefits of scaling model size as a strategy for improving language model performance, but also suggests that scaling alone may not be sufficient to address all types of errors. The annotation explicitly links the error reduction to the scaling process, reinforcing the causal relationship. The chart provides a clear visual representation of the impact of scaling on error rates for different error categories, allowing for a targeted assessment of model strengths and weaknesses.