## Heatmap: Performance Delta Across Models and Mathematical Domains
### Overview
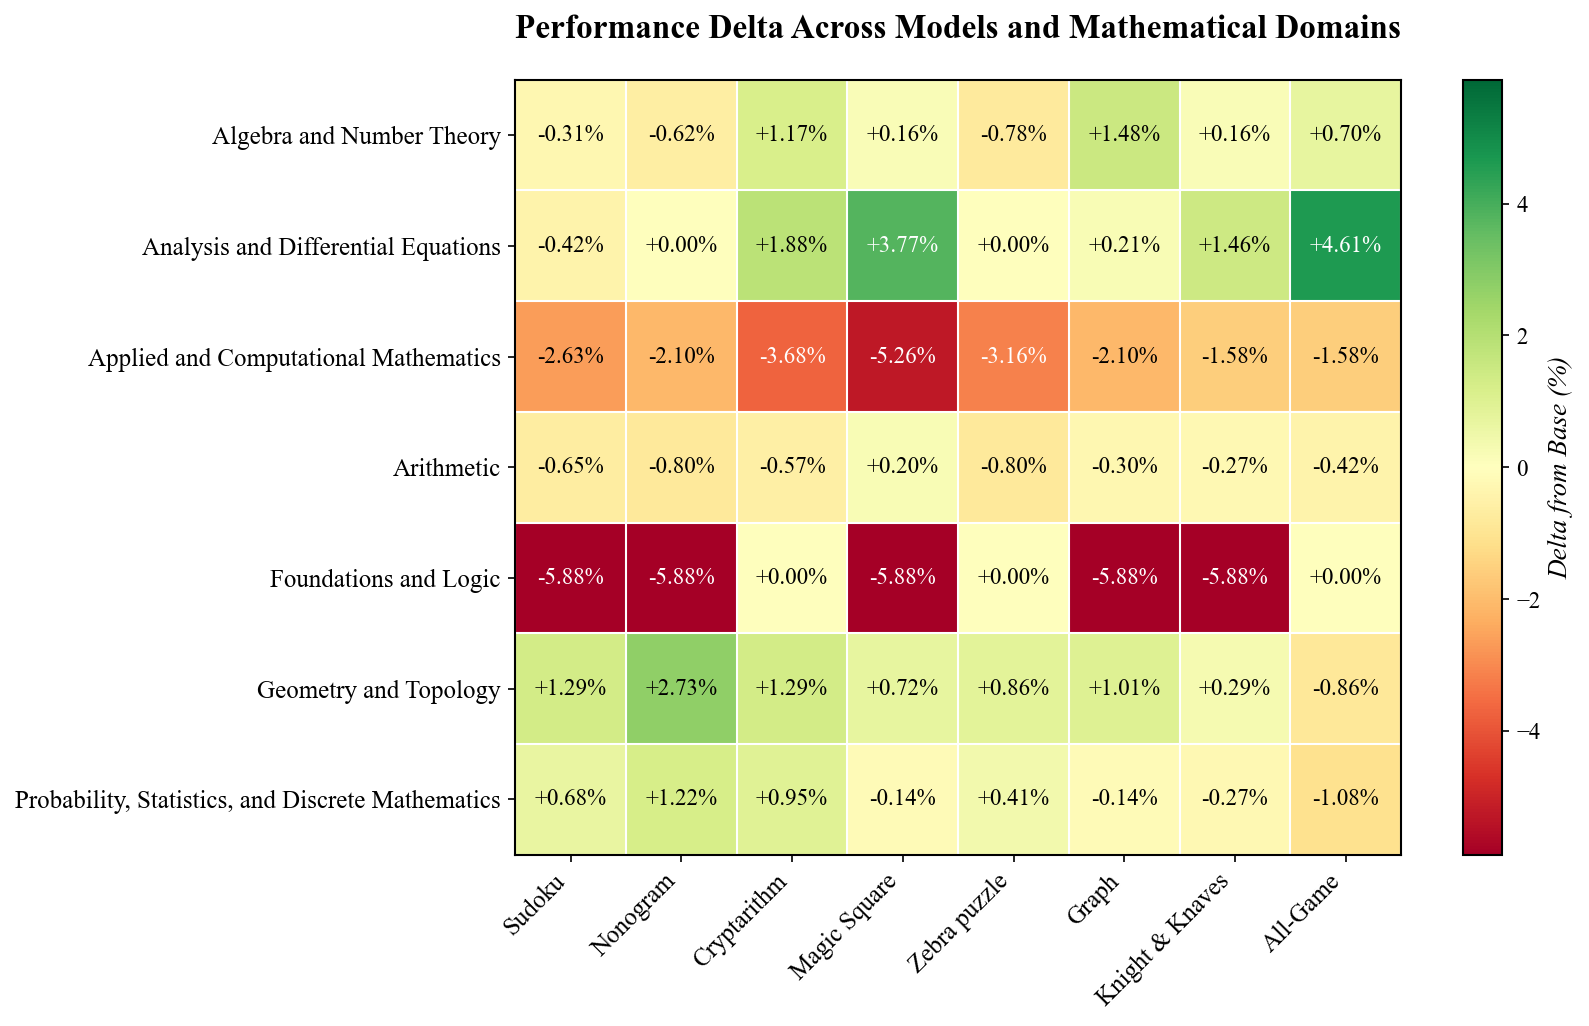
This heatmap visualizes performance deltas (percentage changes from a base value) across mathematical domains and puzzle types. The color gradient ranges from red (-5.88%) to green (+4.61%), with numerical values embedded in each cell.
### Components/Axes
- **X-axis (Columns)**: Puzzle types: Sudoku, Nonogram, Cryptarithm, Magic Square, Zebra puzzle, Graph, Knight & Knaves, All-Game.
- **Y-axis (Rows)**: Mathematical domains: Algebra and Number Theory, Analysis and Differential Equations, Applied and Computational Mathematics, Arithmetic, Foundations and Logic, Geometry and Topology, Probability, Statistics, and Discrete Mathematics.
- **Legend**: Color scale from -5.88% (dark red) to +4.61% (dark green), with intermediate values in yellow/orange.
### Detailed Analysis
- **Algebra and Number Theory**:
- Strongest performance in Cryptarithm (+1.17%) and All-Game (+0.70%).
- Weakest in Sudoku (-0.31%) and Knight & Knaves (-0.62%).
- **Analysis and Differential Equations**:
- Highest delta in Magic Square (+3.77%) and All-Game (+4.61%).
- Neutral in Nonogram and Zebra puzzle (0.00%).
- **Applied and Computational Mathematics**:
- Consistently negative deltas (-2.63% to -1.58%) across all puzzles except Cryptarithm (-3.68%).
- **Arithmetic**:
- Mixed performance: Strong in Magic Square (+0.20%) but weak in Nonogram (-0.80%).
- **Foundations and Logic**:
- Dominantly negative (-5.88%) except in Cryptarithm and Zebra puzzle (0.00%).
- **Geometry and Topology**:
- Positive in Nonogram (+2.73%) and Cryptarithm (+1.29%), but negative in Zebra puzzle (-0.86%).
- **Probability, Statistics, and Discrete Mathematics**:
- Slightly positive in Nonogram (+1.22%) and Cryptarithm (+0.95%), but negative in Magic Square (-0.14%).
### Key Observations
1. **Highest Positive Delta**: Analysis and Differential Equations in Magic Square (+3.77%) and All-Game (+4.61%).
2. **Lowest Delta**: Foundations and Logic in Sudoku, Nonogram, Magic Square, Graph, and Knight & Knaves (-5.88%).
3. **Neutral Performance**: Foundations and Logic in Cryptarithm and Zebra puzzle (0.00%).
4. **Consistent Negatives**: Applied and Computational Mathematics underperforms across all puzzles.
### Interpretation
- **Domain-Specific Strengths**: Analysis and Differential Equations excel in complex puzzles like Magic Square and All-Game, suggesting alignment with advanced problem-solving. Foundations and Logic’s poor performance in most puzzles may indicate a mismatch with their abstract nature.
- **Puzzle-Type Trends**: Magic Square and All-Game show higher variability, possibly due to their reliance on diverse mathematical reasoning.
- **Anomalies**: Foundations and Logic’s 0.00% delta in Cryptarithm and Zebra puzzle implies these puzzles may better suit their logical frameworks despite overall underperformance.
- **Applied Mathematics Gap**: Negative deltas across all puzzles suggest these models struggle with the base performance benchmark, warranting further investigation into their design or training data.
The data highlights the importance of domain-puzzle alignment, with certain mathematical disciplines outperforming others in specific problem types.