## Heatmap: Performance Delta Across Models and Mathematical Domains
### Overview
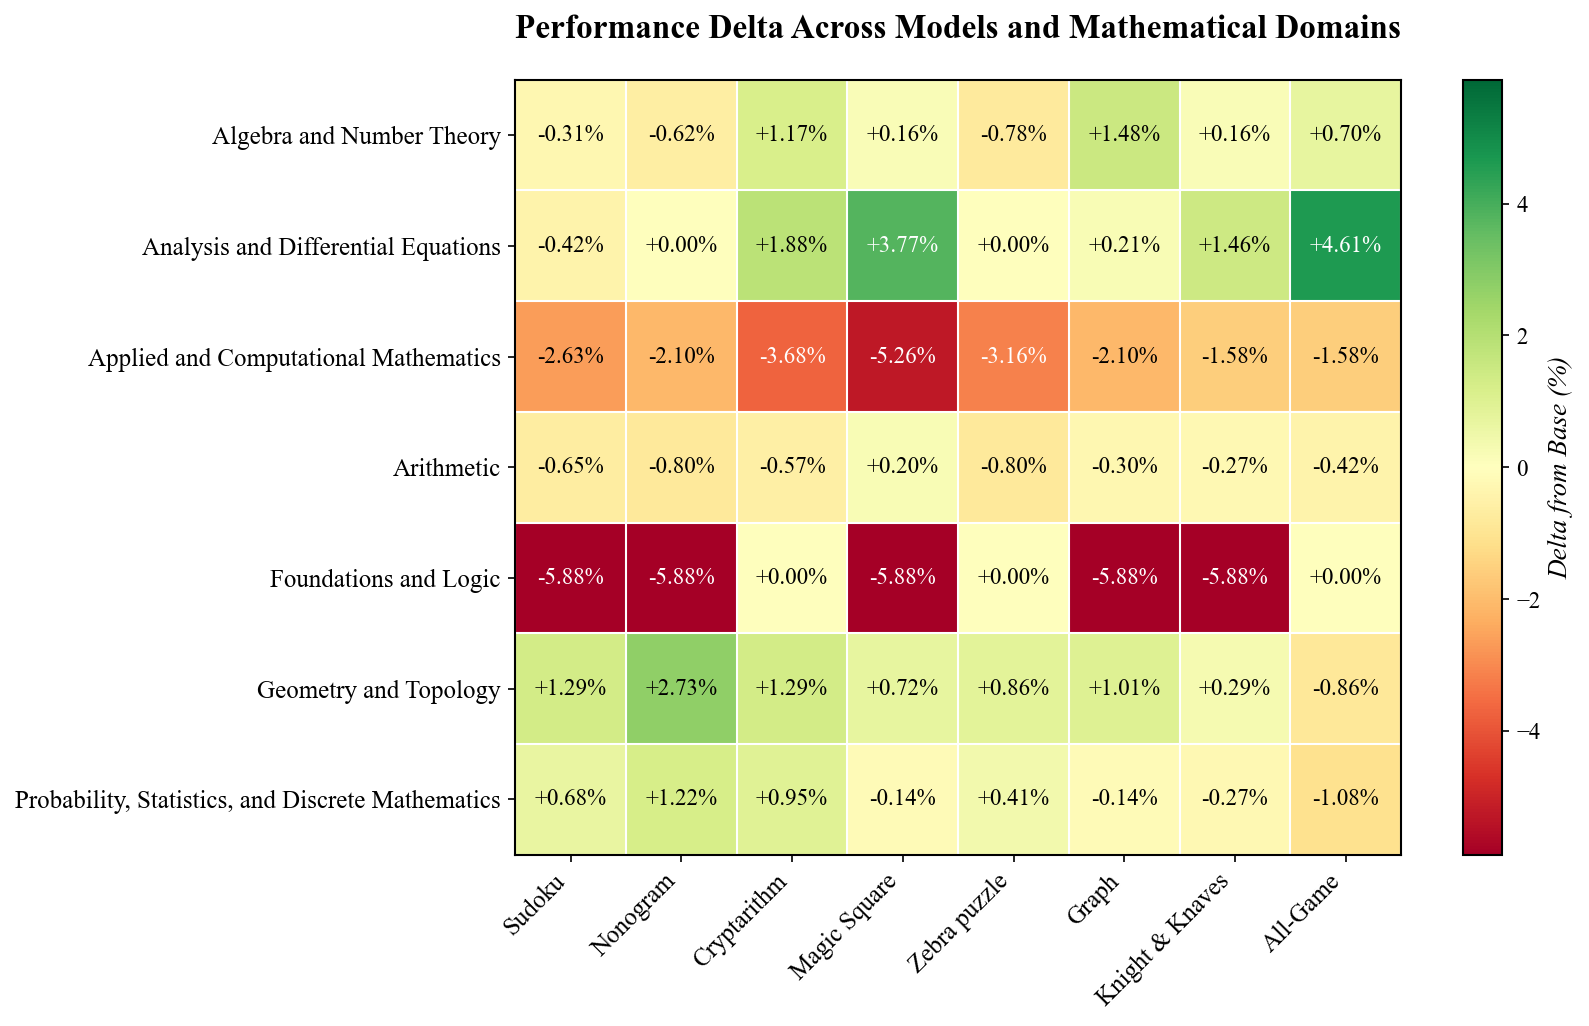
The image is a heatmap displaying the performance delta (in percentage) across different mathematical domains and puzzle types. The color intensity represents the magnitude of the performance difference, with green indicating positive delta (better performance) and red indicating negative delta (worse performance).
### Components/Axes
* **Title:** Performance Delta Across Models and Mathematical Domains
* **Y-axis (Rows):** Mathematical Domains:
* Algebra and Number Theory
* Analysis and Differential Equations
* Applied and Computational Mathematics
* Arithmetic
* Foundations and Logic
* Geometry and Topology
* Probability, Statistics, and Discrete Mathematics
* **X-axis (Columns):** Puzzle Types:
* Sudoku
* Nonogram
* Cryptarithm
* Magic Square
* Zebra puzzle
* Graph
* Knight & Knaves
* All-Game
* **Color Legend (Right):** Delta from Base (%)
* Dark Green: +4
* Light Green: +2
* Yellow: 0
* Orange: -2
* Dark Red: -4
### Detailed Analysis
The heatmap presents performance delta values for each combination of mathematical domain and puzzle type. The values are percentages, indicating the difference in performance compared to a baseline.
* **Algebra and Number Theory:** Performance ranges from -0.78% to +1.48%. Cryptarithm shows the highest positive delta (+1.17%), while Zebra puzzle shows a negative delta of -0.78%.
* **Analysis and Differential Equations:** Performance ranges from -0.42% to +4.61%. Magic Square shows the highest positive delta (+3.77%), and Sudoku shows a negative delta of -0.42%.
* **Applied and Computational Mathematics:** Performance is consistently negative, ranging from -1.58% to -5.26%. Magic Square shows the most negative delta (-5.26%).
* **Arithmetic:** Performance is generally slightly negative, ranging from -0.80% to +0.20%. Magic Square shows a slight positive delta (+0.20%).
* **Foundations and Logic:** Performance is mostly negative (-5.88%) except for Cryptarithm and Zebra puzzle, and All-Game which show 0.00% delta.
* **Geometry and Topology:** Performance is mostly positive, ranging from -0.86% to +2.73%. Nonogram shows the highest positive delta (+2.73%).
* **Probability, Statistics, and Discrete Mathematics:** Performance is mixed, ranging from -1.08% to +1.22%. Nonogram shows the highest positive delta (+1.22%), and All-Game shows the most negative delta (-1.08%).
### Key Observations
* Applied and Computational Mathematics and Foundations and Logic consistently show negative performance deltas across most puzzle types.
* Analysis and Differential Equations shows the highest positive performance delta, particularly for Magic Square.
* The performance varies significantly depending on the combination of mathematical domain and puzzle type.
### Interpretation
The heatmap visualizes how different models perform across various mathematical domains when applied to different puzzle types. The data suggests that the effectiveness of a model is highly dependent on the specific combination of mathematical domain and puzzle type. For example, models perform poorly in Applied and Computational Mathematics, especially with Magic Square puzzles, while they perform well in Analysis and Differential Equations, again with Magic Square puzzles. This could indicate that certain models are better suited for specific types of problems or that certain mathematical domains are more challenging for the models in general. The negative performance in Foundations and Logic suggests potential limitations in handling logical reasoning tasks. The variations highlight the importance of selecting appropriate models based on the specific problem domain.