\n
## Heatmap: Performance Delta Across Models and Mathematical Domains
### Overview
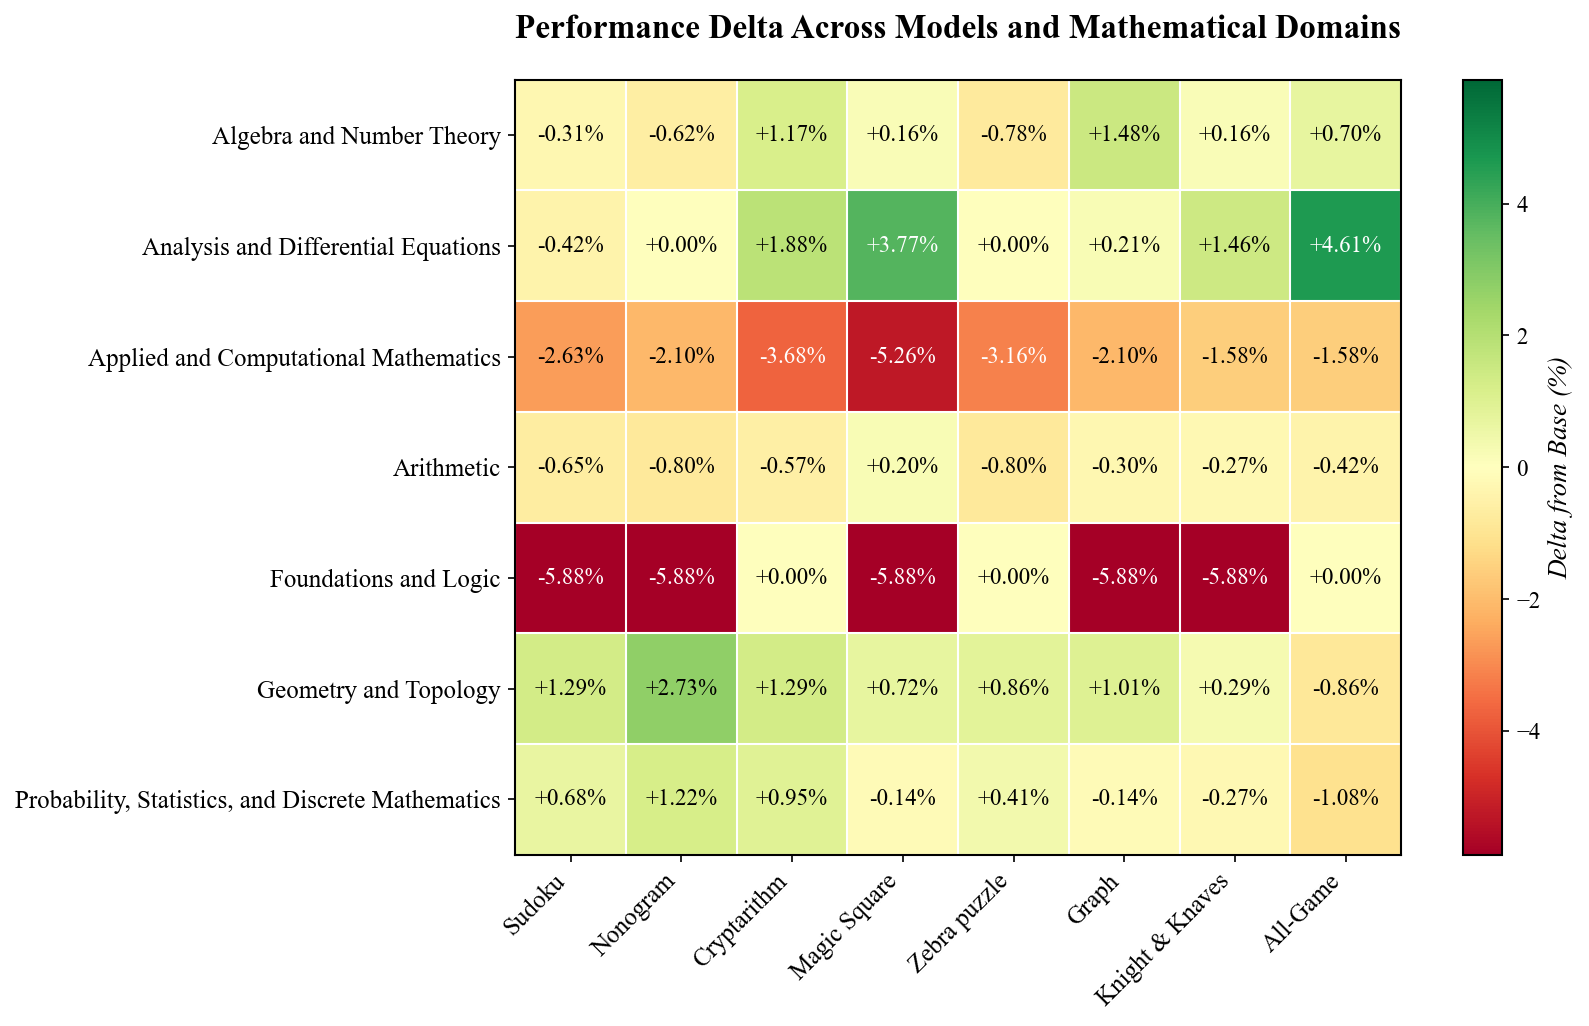
This heatmap visualizes the performance delta (percentage change) of a model across various mathematical domains and specific problem types within those domains. The color intensity represents the magnitude of the delta, with red indicating negative deltas (performance decrease) and green indicating positive deltas (performance increase).
### Components/Axes
* **Title:** "Performance Delta Across Models and Mathematical Domains" (positioned at the top-center)
* **Y-axis (Rows):** Mathematical Domains. The domains listed are:
* Algebra and Number Theory
* Analysis and Differential Equations
* Applied and Computational Mathematics
* Arithmetic
* Foundations and Logic
* Geometry and Topology
* Probability, Statistics, and Discrete Mathematics
* **X-axis (Columns):** Problem Types within the domains. The problem types listed are:
* Sudoku
* Nonogram
* Cryptarithm
* Magic Square
* Zebra puzzle
* Graph
* Knight & Knaves
* All-Game
* **Color Scale (Legend):** Located on the right side of the heatmap. It represents the "Delta from Base (%)", ranging from approximately -4% to +4%.
* Dark Red: Approximately -4%
* Red: Approximately -2%
* White: Approximately 0%
* Light Green: Approximately +2%
* Dark Green: Approximately +4%
### Detailed Analysis
The heatmap contains 7 rows (mathematical domains) and 8 columns (problem types), resulting in 56 data points. The values are percentage changes, and are presented in the cells.
Here's a breakdown of the data, row by row:
* **Algebra and Number Theory:**
* Sudoku: -0.31%
* Nonogram: -0.62%
* Cryptarithm: +1.17%
* Magic Square: -0.16%
* Zebra puzzle: -0.78%
* Graph: +1.48%
* Knight & Knaves: +0.16%
* All-Game: +0.70%
* **Analysis and Differential Equations:**
* Sudoku: -0.42%
* Nonogram: +0.00%
* Cryptarithm: +1.83%
* Magic Square: +3.77%
* Zebra puzzle: +0.00%
* Graph: +0.21%
* Knight & Knaves: +1.46%
* All-Game: +4.61%
* **Applied and Computational Mathematics:**
* Sudoku: -2.63%
* Nonogram: -2.10%
* Cryptarithm: -3.68%
* Magic Square: -5.26%
* Zebra puzzle: -3.16%
* Graph: -2.10%
* Knight & Knaves: -1.58%
* All-Game: -1.58%
* **Arithmetic:**
* Sudoku: -0.65%
* Nonogram: -0.80%
* Cryptarithm: -0.57%
* Magic Square: -0.20%
* Zebra puzzle: -0.80%
* Graph: -0.30%
* Knight & Knaves: -0.27%
* All-Game: -0.42%
* **Foundations and Logic:**
* Sudoku: -5.88%
* Nonogram: -5.88%
* Cryptarithm: -0.00%
* Magic Square: -5.88%
* Zebra puzzle: -0.00%
* Graph: -5.88%
* Knight & Knaves: -5.88%
* All-Game: +0.00%
* **Geometry and Topology:**
* Sudoku: +1.29%
* Nonogram: +2.73%
* Cryptarithm: +1.29%
* Magic Square: +0.72%
* Zebra puzzle: +0.86%
* Graph: +1.01%
* Knight & Knaves: +0.29%
* All-Game: -0.86%
* **Probability, Statistics, and Discrete Mathematics:**
* Sudoku: +0.68%
* Nonogram: +1.22%
* Cryptarithm: +0.95%
* Magic Square: -0.14%
* Zebra puzzle: +0.41%
* Graph: -0.14%
* Knight & Knaves: -0.27%
* All-Game: -1.08%
### Key Observations
* **Foundations and Logic** consistently shows the largest negative deltas across all problem types, except for "All-Game" which shows no change.
* **Applied and Computational Mathematics** also exhibits largely negative deltas, with the most significant decrease observed for "Magic Square" (-5.26%).
* **Analysis and Differential Equations** demonstrates the most positive deltas, particularly for "Magic Square" (+3.77%) and "All-Game" (+4.61%).
* **Geometry and Topology** generally shows positive deltas, with "Nonogram" having the largest positive change (+2.73%).
* The "All-Game" performance is mixed, showing no change for Foundations and Logic, a large positive change for Analysis and Differential Equations, and negative changes for Applied and Computational Mathematics and Probability, Statistics, and Discrete Mathematics.
### Interpretation
The heatmap suggests that the model performs significantly worse on problems related to Foundations and Logic, and to a lesser extent, Applied and Computational Mathematics. Conversely, it performs better on problems within Analysis and Differential Equations and Geometry and Topology. The "All-Game" metric, representing a combined performance, shows a varied response, indicating that the model's strengths and weaknesses are not uniformly distributed across different problem types.
The large negative deltas in Foundations and Logic could indicate a limitation in the model's ability to handle abstract reasoning or formal systems. The positive deltas in Analysis and Differential Equations might suggest the model is well-suited for tasks involving continuous functions and calculus. The mixed results for "All-Game" suggest that simply averaging performance across domains may not accurately reflect the model's overall capabilities.
Further investigation is needed to understand the underlying reasons for these performance differences. This could involve analyzing the model's architecture, training data, and the specific characteristics of each problem type. The heatmap provides a valuable starting point for identifying areas where the model needs improvement and for guiding future research efforts.