## Diagram: UCB and LCB Overlap
### Overview
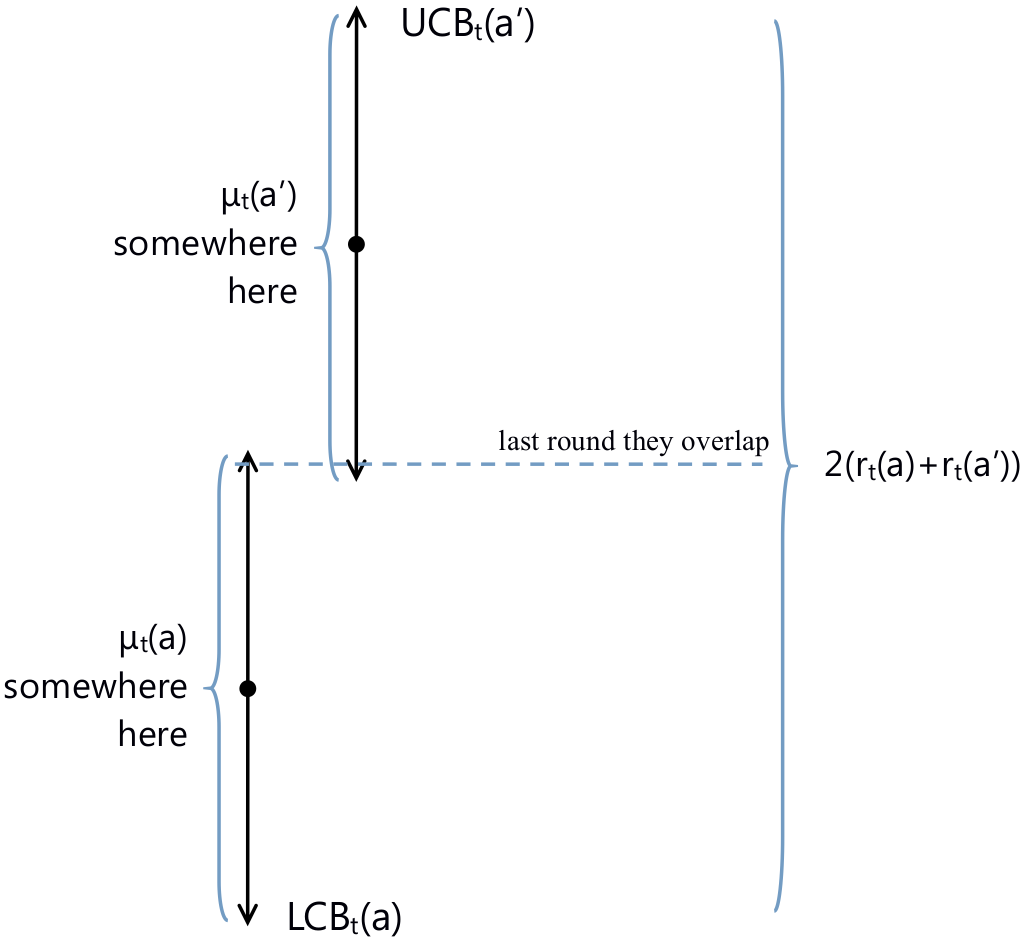
The image is a diagram illustrating the relationship between Upper Confidence Bound (UCB) and Lower Confidence Bound (LCB) for two actions, 'a' and 'a\''. It shows the bounds, their means, and the condition under which they overlap.
### Components/Axes
* **Vertical Arrows:** Two vertical arrows, one on the left and one on the right, indicate the range between the UCB and LCB for each action.
* **Labels:**
* Left side, top: "UCB<sub>t</sub>(a')"
* Left side, near the middle: "μ<sub>t</sub>(a') somewhere here"
* Left side, near the bottom: "μ<sub>t</sub>(a) somewhere here"
* Left side, bottom: "LCB<sub>t</sub>(a)"
* Right side: "2(r<sub>t</sub>(a) + r<sub>t</sub>(a'))"
* Horizontal dashed line: "last round they overlap"
### Detailed Analysis
* **UCB<sub>t</sub>(a')**: The top of the left arrow points to UCB<sub>t</sub>(a'). The arrow extends downwards to a point above the horizontal dashed line.
* **μ<sub>t</sub>(a') somewhere here**: A black dot is positioned on the left side, indicating the mean value μ<sub>t</sub>(a'). It is located somewhere between UCB<sub>t</sub>(a') and the top of the dashed line.
* **Horizontal Dashed Line**: A horizontal dashed line extends from the bottom of the left arrow to the right side of the diagram. It is labeled "last round they overlap".
* **2(r<sub>t</sub>(a) + r<sub>t</sub>(a'))**: The right side of the diagram has a vertical line extending from the horizontal dashed line downwards. The entire length of this line is labeled "2(r<sub>t</sub>(a) + r<sub>t</sub>(a'))".
* **μ<sub>t</sub>(a) somewhere here**: A black dot is positioned on the left side, indicating the mean value μ<sub>t</sub>(a'). It is located somewhere between the top of the dashed line and LCB<sub>t</sub>(a).
* **LCB<sub>t</sub>(a)**: The bottom of the left arrow points to LCB<sub>t</sub>(a).
### Key Observations
* The diagram illustrates the concept of UCB and LCB for two actions, 'a' and 'a\''.
* The horizontal dashed line represents the point where the UCB of action 'a'' and the LCB of action 'a' overlap.
* The length of the vertical line on the right represents "2(r<sub>t</sub>(a) + r<sub>t</sub>(a'))", which is related to the difference between the UCB and LCB values.
### Interpretation
The diagram visually explains a condition in reinforcement learning where the upper confidence bound of one action (a') and the lower confidence bound of another action (a) overlap. This overlap suggests that, based on the current information, it is difficult to definitively say which action is better. The value "2(r<sub>t</sub>(a) + r<sub>t</sub>(a'))" likely represents a measure of the uncertainty or potential reward difference between the two actions. The diagram is useful for understanding exploration-exploitation trade-offs in reinforcement learning algorithms like UCB. The algorithm would need to explore further to resolve the uncertainty and determine the optimal action.