# Technical Document Extraction: Upper Confidence Bound (UCB) Overlap Diagram
## 1. Image Overview
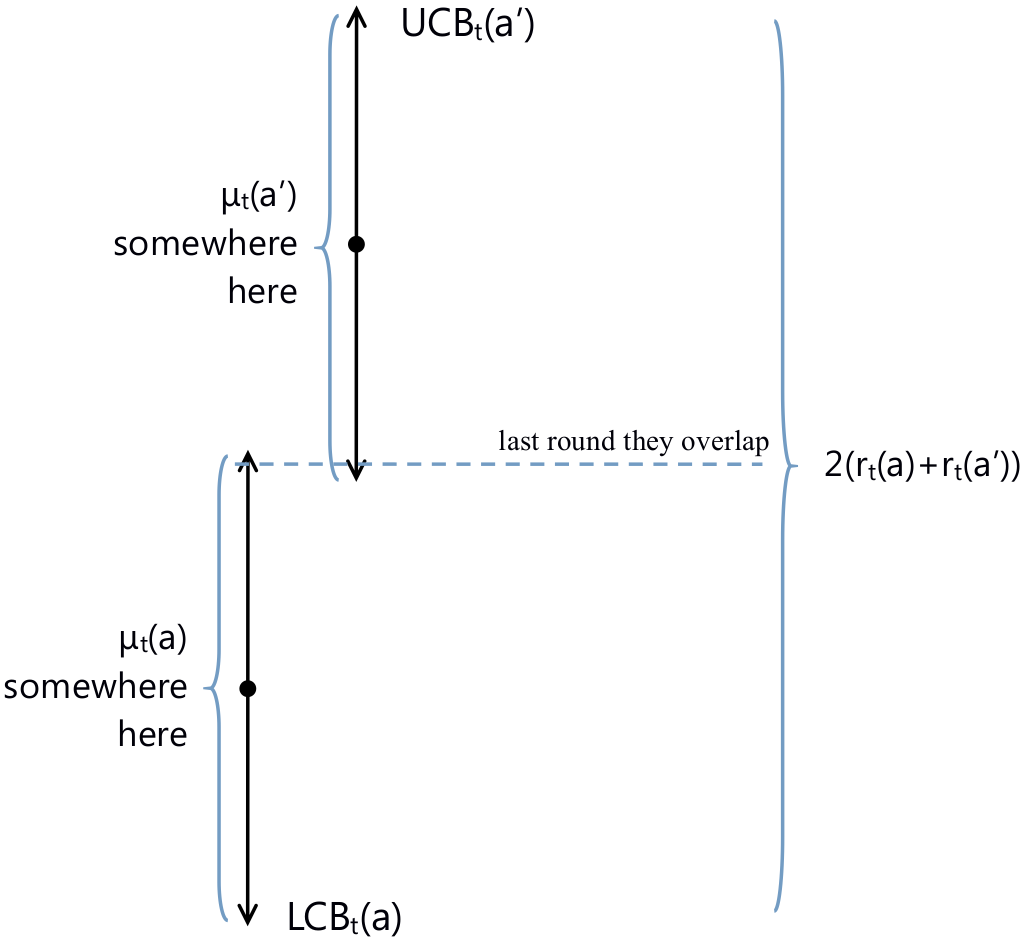
This image is a technical diagram illustrating the relationship between confidence intervals for two different actions (denoted as $a$ and $a'$) in the context of a Multi-Armed Bandit problem or a similar reinforcement learning algorithm. It specifically visualizes the "last round they overlap," representing the boundary condition for regret or sub-optimality.
## 2. Component Isolation
### Region A: Upper Confidence Interval (Action $a'$)
* **Location:** Top-center of the image.
* **Visual Element:** A vertical black line with double-headed arrows. A solid black dot is positioned in the center of this line.
* **Top Label:** $UCB_t(a')$ (Upper Confidence Bound for action $a'$ at time $t$).
* **Left Annotation:** A light blue curly bracket spans the length of this vertical line, labeled with the text:
> $\mu_t(a')$
> somewhere
> here
* **Interpretation:** This represents the estimated mean and uncertainty range for action $a'$.
### Region B: Lower Confidence Interval (Action $a$)
* **Location:** Bottom-center of the image, slightly offset to the left of the upper interval.
* **Visual Element:** A vertical black line with double-headed arrows. A solid black dot is positioned in the center of this line.
* **Bottom Label:** $LCB_t(a)$ (Lower Confidence Bound for action $a$ at time $t$).
* **Left Annotation:** A light blue curly bracket spans the length of this vertical line, labeled with the text:
> $\mu_t(a)$
> somewhere
> here
* **Interpretation:** This represents the estimated mean and uncertainty range for action $a$.
### Region C: Interaction Boundary
* **Visual Element:** A horizontal dashed blue line.
* **Alignment:** This line aligns exactly with the **bottom** arrow of the $UCB_t(a')$ interval and the **top** arrow of the $LCB_t(a)$ interval.
* **Text Label (Above Line):** "last round they overlap"
* **Interpretation:** This indicates the point where the upper bound of the lower action meets the lower bound of the higher action.
### Region D: Total Range Scale
* **Location:** Far right side of the image.
* **Visual Element:** A large, light blue curly bracket spanning the entire vertical distance from the top of $UCB_t(a')$ to the bottom of $LCB_t(a)$.
* **Right Label:** $2(r_t(a) + r_t(a'))$
* **Interpretation:** This defines the total vertical distance of the combined confidence intervals as twice the sum of the radii (confidence widths) of the two actions.
## 3. Mathematical and Logical Flow
The diagram illustrates a critical state in exploration-exploitation algorithms:
1. **Action $a'$** is currently estimated to have a higher mean than **Action $a$**.
2. The uncertainty (represented by the vertical lines) shows that the true means ($\mu$) could be anywhere within those brackets.
3. The **"last round they overlap"** occurs when the lower bound of the superior action's estimate meets the upper bound of the inferior action's estimate.
4. The total distance between the highest possible value ($UCB_t(a')$) and the lowest possible value ($LCB_t(a)$) is quantified as $2(r_t(a) + r_t(a'))$, where $r_t$ represents the confidence radius or "bonus" added to the empirical mean.
## 4. Text Transcription Summary
| Label/Text | Context |
| :--- | :--- |
| $UCB_t(a')$ | Top boundary of the upper interval. |
| $\mu_t(a')$ somewhere here | Description of the possible true mean for action $a'$. |
| last round they overlap | Description of the horizontal dashed line where intervals meet. |
| $2(r_t(a) + r_t(a'))$ | Total vertical span of both intervals combined. |
| $\mu_t(a)$ somewhere here | Description of the possible true mean for action $a$. |
| $LCB_t(a)$ | Bottom boundary of the lower interval. |