\n
## Diagram: Upper Confidence Bound (UCB) Illustration
### Overview
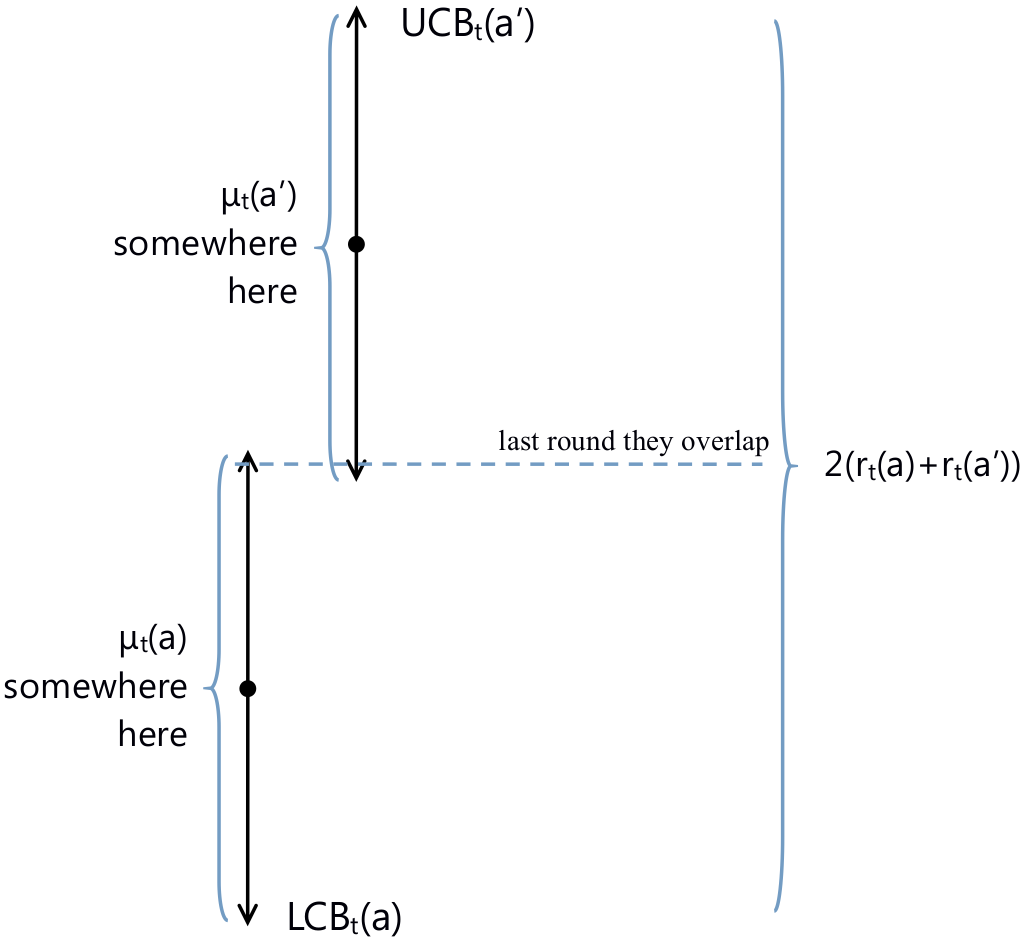
The image is a diagram illustrating the concept of Upper Confidence Bound (UCB) in a decision-making process, likely related to bandit algorithms or exploration-exploitation trade-offs. It visually represents the upper and lower confidence bounds around estimated means, and their relationship to uncertainty.
### Components/Axes
The diagram consists of vertical arrows representing the Upper Confidence Bound (UCB) and Lower Confidence Bound (LCB) for two actions, 'a' and 'a''. There are labels indicating the estimated means μ<sub>t</sub>(a) and μ<sub>t</sub>(a') and the confidence interval width 2(r<sub>t</sub>(a) + r<sub>t</sub>(a')). A dashed line indicates overlap between the confidence intervals. The diagram has a vertical axis representing value or reward, but it is not explicitly labeled with numerical scales.
### Detailed Analysis or Content Details
* **UCB<sub>t</sub>(a')**: A blue upward-pointing arrow, starting from a point representing μ<sub>t</sub>(a') and extending upwards.
* **μ<sub>t</sub>(a')**: Label indicating the estimated mean for action 'a' at time 't'. The text "somewhere here" suggests the exact value is not specified.
* **LCB<sub>t</sub>(a)**: A blue downward-pointing arrow, starting from a point representing μ<sub>t</sub>(a) and extending downwards.
* **μ<sub>t</sub>(a)**: Label indicating the estimated mean for action 'a' at time 't'. The text "somewhere here" suggests the exact value is not specified.
* **2(r<sub>t</sub>(a) + r<sub>t</sub>(a'))**: A bracket on the right side of the diagram, indicating the total width of the confidence intervals for both actions 'a' and 'a''. This represents twice the sum of the radii (uncertainties) for actions 'a' and 'a''.
* **"last round they overlap"**: A dashed horizontal line connecting the two confidence intervals, indicating that the confidence intervals for actions 'a' and 'a'' overlapped in the previous round.
### Key Observations
The diagram highlights the following:
* The UCB and LCB define a range of possible values for the true mean of each action.
* The width of the confidence interval is determined by the uncertainty (represented by r<sub>t</sub>(a) and r<sub>t</sub>(a')).
* The overlap of the confidence intervals suggests that the algorithm is uncertain about which action is truly better.
* The UCB is used to select the action with the highest potential reward, considering both the estimated mean and the uncertainty.
### Interpretation
This diagram illustrates a core concept in reinforcement learning and bandit algorithms. The UCB strategy aims to balance exploration (trying actions with high uncertainty) and exploitation (choosing actions with high estimated rewards). The UCB is calculated by adding a confidence bonus to the estimated mean, which encourages the algorithm to explore actions with wider confidence intervals.
The overlap of the confidence intervals indicates that the algorithm has not yet gathered enough information to confidently distinguish between the two actions. In this case, the UCB will likely favor the action with the higher estimated mean, but the confidence bonus will still allow for some exploration.
The diagram is a simplified representation of the UCB algorithm, but it effectively conveys the key idea of balancing exploration and exploitation. The "somewhere here" labels suggest that the diagram is intended to be a conceptual illustration rather than a precise quantitative analysis. The diagram does not provide specific numerical data, but rather focuses on the relationships between the different components of the UCB strategy.