## Diagram: Confidence Bound Overlap Illustration
### Overview
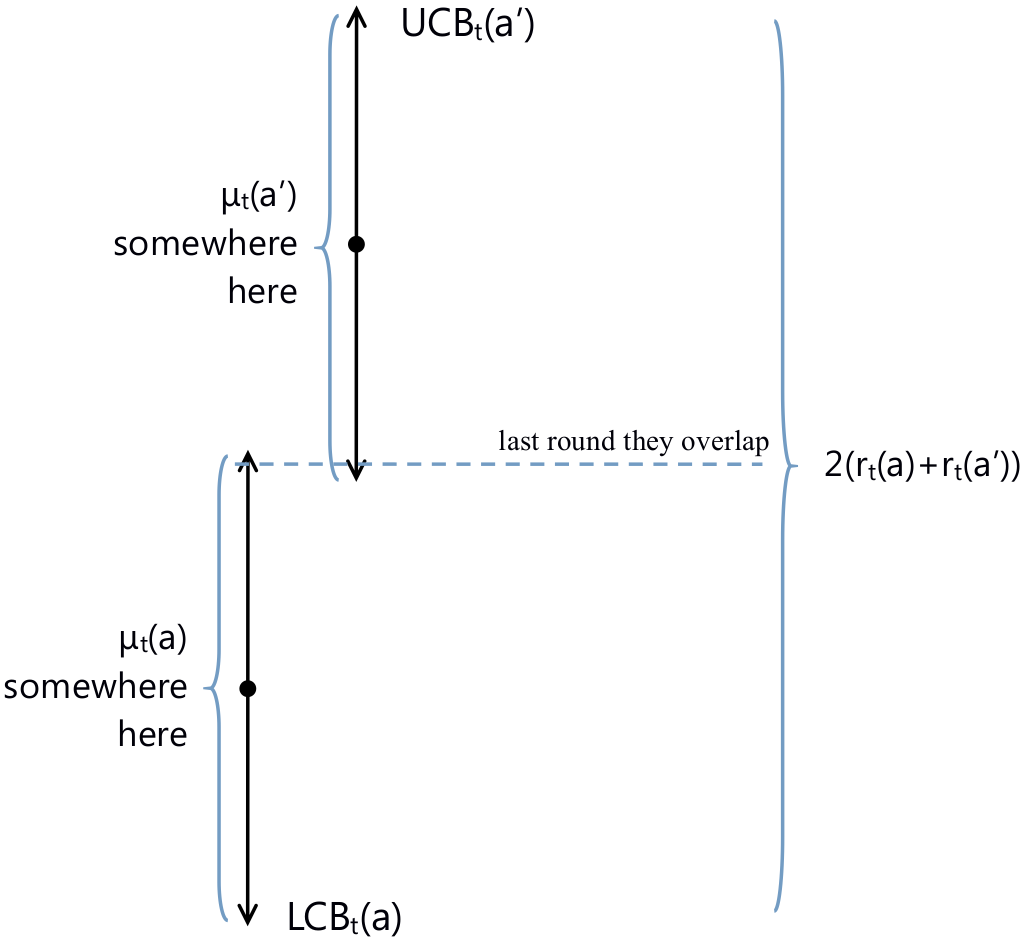
The diagram illustrates the relationship between upper and lower confidence bounds (UCB and LCB) for two actions, `a` and `a'`, with a focus on their overlap in the "last round." It includes labeled points, mathematical expressions, and spatial annotations to depict the bounds and their interaction.
---
### Components/Axes
- **Vertical Lines**:
- **Top Line**: Labeled `UCB_t(a')` (Upper Confidence Bound for action `a'`), with a point marked `μ_t(a')` ("somewhere here").
- **Bottom Line**: Labeled `LCB_t(a)` (Lower Confidence Bound for action `a`), with a point marked `μ_t(a)` ("somewhere here").
- **Horizontal Dashed Line**:
- Connects the two vertical lines, labeled `"last round they overlap"`.
- Contains the equation `2(r_t(a) + r_t(a'))` on the right side.
- **Annotations**:
- `μ_t(a)` and `μ_t(a')` are positioned near the bottom and top vertical lines, respectively.
- The dashed line spans the width of the diagram, linking the two bounds.
---
### Detailed Analysis
- **UCB_t(a')**: A vertical line extending upward from the top of the diagram, with a point `μ_t(a')` placed within its bounds.
- **LCB_t(a)**: A vertical line extending downward from the bottom of the diagram, with a point `μ_t(a)` placed within its bounds.
- **Overlap**: The dashed line indicates that the bounds for `a` and `a'` overlap in the "last round," with the equation `2(r_t(a) + r_t(a'))` suggesting a relationship between the bounds and their overlap.
- **Spatial Placement**:
- The UCB_t(a') line is positioned above the LCB_t(a) line.
- The dashed line is centered horizontally between the two vertical lines, emphasizing the overlap.
---
### Key Observations
1. **Bound Relationships**: The diagram visually distinguishes between the upper and lower confidence bounds for two actions, with their respective points (`μ_t(a)` and `μ_t(a')`) located within their bounds.
2. **Overlap Significance**: The dashed line and equation `2(r_t(a) + r_t(a'))` imply that the overlap in the "last round" is quantified by this expression, possibly representing a combined metric or threshold.
3. **Label Clarity**: All labels are explicitly annotated, with no ambiguity in the placement of `UCB_t(a')`, `LCB_t(a)`, and the overlap equation.
---
### Interpretation
The diagram likely represents a scenario in a decision-making or optimization context (e.g., multi-armed bandits, reinforcement learning) where confidence bounds for actions are tracked over time. The overlap in the "last round" suggests that the bounds for `a` and `a'` intersect, which could indicate equivalence in their performance metrics or a critical decision point. The equation `2(r_t(a) + r_t(a'))` may quantify the magnitude of this overlap, potentially used to adjust strategies or evaluate trade-offs between actions. The spatial arrangement reinforces the hierarchical relationship between the bounds, with `UCB_t(a')` positioned above `LCB_t(a)`, reflecting their respective roles in upper and lower limits.