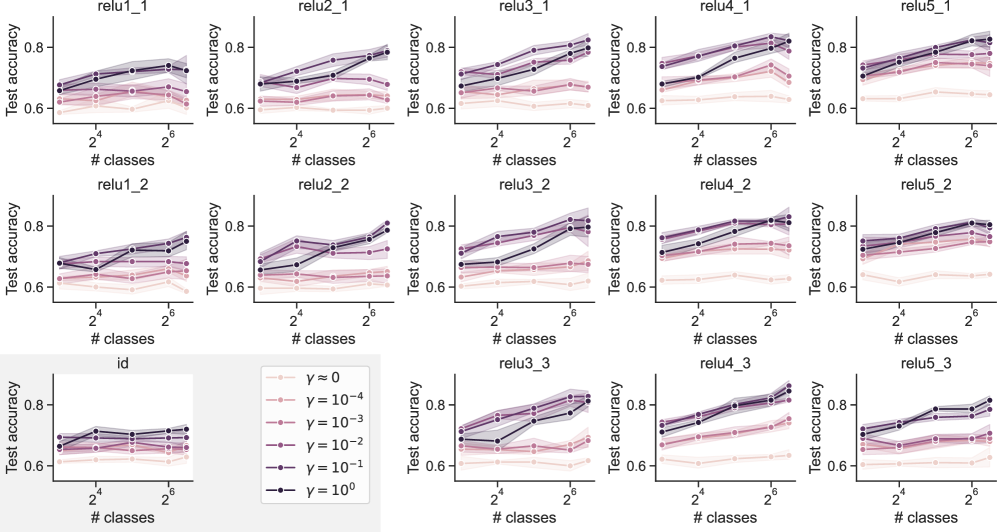
## Chart Type: Multiple Line Graphs Comparing Test Accuracy vs. Number of Classes
### Overview
The image contains a 5x3 grid of line graphs. Each graph displays the "Test accuracy" on the y-axis versus the "# classes" on the x-axis. The x-axis is displayed on a log scale. Each graph contains 6 lines, each representing a different value of gamma (γ). The legend in the bottom-center describes the color-coding for the different gamma values. The graphs are titled "relu[1-5]_[1-3]" and "id".
### Components/Axes
* **X-axis:** "# classes" with tick marks at 2<sup>2</sup>, 2<sup>4</sup>, and 2<sup>6</sup>.
* **Y-axis:** "Test accuracy" ranging from 0.6 to 0.8.
* **Titles:** Each graph has a title in the format "relu[number]_[number]" or "id". The titles are arranged in a grid:
* Top row: relu1\_1, relu2\_1, relu3\_1, relu4\_1, relu5\_1
* Middle row: relu1\_2, relu2\_2, relu3\_2, relu4\_2, relu5\_2
* Bottom row: id, relu3\_3, relu4\_3, relu5\_3
* **Legend:** Located at the bottom-center of the image. It maps colors to gamma (γ) values:
* Light pink: γ ≈ 0
* Pink: γ = 10<sup>-4</sup>
* Rose: γ = 10<sup>-3</sup>
* Purple: γ = 10<sup>-2</sup>
* Dark Purple: γ = 10<sup>-1</sup>
* Black: γ = 10<sup>0</sup>
### Detailed Analysis
Each graph plots the test accuracy against the number of classes for different values of gamma. The x-axis values are 2<sup>2</sup> = 4, 2<sup>4</sup> = 16, and 2<sup>6</sup> = 64.
**General Trends:**
* **γ ≈ 0 (Light Pink):** Generally shows the lowest test accuracy across all graphs. The test accuracy is relatively flat as the number of classes increases.
* **γ = 10<sup>0</sup> (Black):** Generally shows the highest test accuracy across all graphs. The test accuracy tends to increase as the number of classes increases.
* **Other Gamma Values:** The lines for γ = 10<sup>-4</sup>, 10<sup>-3</sup>, 10<sup>-2</sup>, and 10<sup>-1</sup> (Pink, Rose, Purple, Dark Purple) fall between the γ ≈ 0 and γ = 10<sup>0</sup> lines. Their behavior varies across the different graphs.
**Specific Graph Observations:**
* **relu1\_1:**
* γ ≈ 0: Test accuracy around 0.62 at 2<sup>2</sup>, 0.63 at 2<sup>4</sup>, and 0.62 at 2<sup>6</sup>.
* γ = 10<sup>0</sup>: Test accuracy around 0.68 at 2<sup>2</sup>, 0.73 at 2<sup>4</sup>, and 0.75 at 2<sup>6</sup>.
* **relu1\_2:**
* γ ≈ 0: Test accuracy around 0.63 at 2<sup>2</sup>, 0.64 at 2<sup>4</sup>, and 0.63 at 2<sup>6</sup>.
* γ = 10<sup>0</sup>: Test accuracy around 0.68 at 2<sup>2</sup>, 0.74 at 2<sup>4</sup>, and 0.76 at 2<sup>6</sup>.
* **relu2\_1:**
* γ ≈ 0: Test accuracy around 0.62 at 2<sup>2</sup>, 0.63 at 2<sup>4</sup>, and 0.62 at 2<sup>6</sup>.
* γ = 10<sup>0</sup>: Test accuracy around 0.69 at 2<sup>2</sup>, 0.74 at 2<sup>4</sup>, and 0.76 at 2<sup>6</sup>.
* **relu2\_2:**
* γ ≈ 0: Test accuracy around 0.63 at 2<sup>2</sup>, 0.64 at 2<sup>4</sup>, and 0.63 at 2<sup>6</sup>.
* γ = 10<sup>0</sup>: Test accuracy around 0.69 at 2<sup>2</sup>, 0.74 at 2<sup>4</sup>, and 0.76 at 2<sup>6</sup>.
* **relu3\_1:**
* γ ≈ 0: Test accuracy around 0.62 at 2<sup>2</sup>, 0.63 at 2<sup>4</sup>, and 0.62 at 2<sup>6</sup>.
* γ = 10<sup>0</sup>: Test accuracy around 0.70 at 2<sup>2</sup>, 0.76 at 2<sup>4</sup>, and 0.79 at 2<sup>6</sup>.
* **relu3\_2:**
* γ ≈ 0: Test accuracy around 0.63 at 2<sup>2</sup>, 0.64 at 2<sup>4</sup>, and 0.63 at 2<sup>6</sup>.
* γ = 10<sup>0</sup>: Test accuracy around 0.70 at 2<sup>2</sup>, 0.76 at 2<sup>4</sup>, and 0.80 at 2<sup>6</sup>.
* **relu3\_3:**
* γ ≈ 0: Test accuracy around 0.62 at 2<sup>2</sup>, 0.63 at 2<sup>4</sup>, and 0.62 at 2<sup>6</sup>.
* γ = 10<sup>0</sup>: Test accuracy around 0.70 at 2<sup>2</sup>, 0.76 at 2<sup>4</sup>, and 0.80 at 2<sup>6</sup>.
* **relu4\_1:**
* γ ≈ 0: Test accuracy around 0.62 at 2<sup>2</sup>, 0.63 at 2<sup>4</sup>, and 0.62 at 2<sup>6</sup>.
* γ = 10<sup>0</sup>: Test accuracy around 0.72 at 2<sup>2</sup>, 0.77 at 2<sup>4</sup>, and 0.81 at 2<sup>6</sup>.
* **relu4\_2:**
* γ ≈ 0: Test accuracy around 0.63 at 2<sup>2</sup>, 0.64 at 2<sup>4</sup>, and 0.63 at 2<sup>6</sup>.
* γ = 10<sup>0</sup>: Test accuracy around 0.72 at 2<sup>2</sup>, 0.77 at 2<sup>4</sup>, and 0.81 at 2<sup>6</sup>.
* **relu4\_3:**
* γ ≈ 0: Test accuracy around 0.62 at 2<sup>2</sup>, 0.63 at 2<sup>4</sup>, and 0.62 at 2<sup>6</sup>.
* γ = 10<sup>0</sup>: Test accuracy around 0.72 at 2<sup>2</sup>, 0.77 at 2<sup>4</sup>, and 0.81 at 2<sup>6</sup>.
* **relu5\_1:**
* γ ≈ 0: Test accuracy around 0.62 at 2<sup>2</sup>, 0.63 at 2<sup>4</sup>, and 0.62 at 2<sup>6</sup>.
* γ = 10<sup>0</sup>: Test accuracy around 0.71 at 2<sup>2</sup>, 0.76 at 2<sup>4</sup>, and 0.79 at 2<sup>6</sup>.
* **relu5\_2:**
* γ ≈ 0: Test accuracy around 0.63 at 2<sup>2</sup>, 0.64 at 2<sup>4</sup>, and 0.63 at 2<sup>6</sup>.
* γ = 10<sup>0</sup>: Test accuracy around 0.71 at 2<sup>2</sup>, 0.76 at 2<sup>4</sup>, and 0.79 at 2<sup>6</sup>.
* **relu5\_3:**
* γ ≈ 0: Test accuracy around 0.62 at 2<sup>2</sup>, 0.63 at 2<sup>4</sup>, and 0.62 at 2<sup>6</sup>.
* γ = 10<sup>0</sup>: Test accuracy around 0.71 at 2<sup>2</sup>, 0.76 at 2<sup>4</sup>, and 0.79 at 2<sup>6</sup>.
* **id:**
* γ ≈ 0: Test accuracy around 0.64 at 2<sup>2</sup>, 0.65 at 2<sup>4</sup>, and 0.64 at 2<sup>6</sup>.
* γ = 10<sup>0</sup>: Test accuracy around 0.70 at 2<sup>2</sup>, 0.71 at 2<sup>4</sup>, and 0.72 at 2<sup>6</sup>.
### Key Observations
* The test accuracy generally increases with the number of classes for higher values of gamma (γ = 10<sup>0</sup>).
* The test accuracy is relatively flat for γ ≈ 0.
* The "relu" graphs show similar trends, with "relu4\_*" generally having the highest test accuracy for γ = 10<sup>0</sup>.
* The "id" graph shows a smaller increase in test accuracy with the number of classes compared to the "relu" graphs.
### Interpretation
The graphs suggest that a higher gamma value (γ = 10<sup>0</sup>) leads to better test accuracy, especially as the number of classes increases. The "relu" activation functions seem to perform better than the "id" (identity) activation function, as they achieve higher test accuracies. The relatively flat test accuracy for γ ≈ 0 indicates that a very small gamma value might not be sufficient for effective learning. The differences in performance between the "relu" graphs (relu1\_1, relu1\_2, etc.) could be due to variations in the network architecture or training data.