\n
## Chart: Test Accuracy vs. Number of Classes for Different Regularization Parameters
### Overview
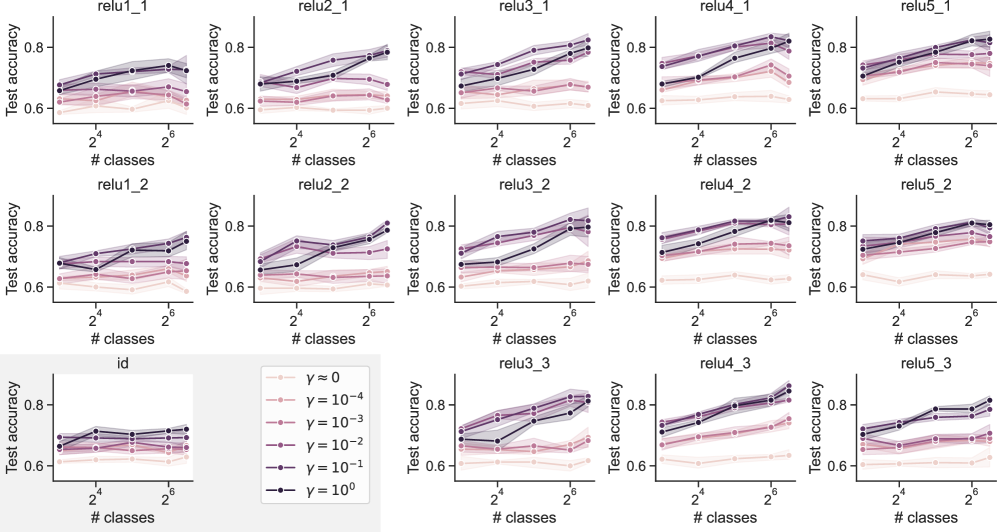
This image presents a grid of 15 line plots, each showing the relationship between "Test accuracy" and "# classes" for different ReLU layer configurations (relu1_1 to relu5_3) and regularization parameters (γ). Each plot visualizes the performance of a model under varying numbers of classes, with different levels of regularization applied. The x-axis represents the number of classes, ranging from 2^0 (1) to 2^6 (64), displayed on a logarithmic scale. The y-axis represents the test accuracy, ranging from approximately 0.6 to 0.9.
### Components/Axes
* **X-axis Label:** "# classes" (logarithmic scale)
* **Y-axis Label:** "Test accuracy"
* **Legend:** Located in the bottom-right corner, it defines the different regularization parameters (γ) represented by different line styles and colors:
* γ = 0 (pink, dashed)
* γ = 10^-4 (light green, dashed)
* γ = 10^-3 (light blue, dashed)
* γ = 10^-2 (light purple, dashed)
* γ = 10^-1 (black, solid)
* γ = 10^0 (dark red, solid)
* **Subplot Titles:** Each subplot is labeled with a combination of "relu" layer number and a second index (e.g., "relu1\_1", "relu5\_3").
* **Data Points:** Each line represents the test accuracy for a specific regularization parameter as the number of classes increases. Shaded areas around the lines represent the standard deviation or confidence interval.
### Detailed Analysis or Content Details
The image consists of a 3x5 grid of plots. Here's a breakdown of the trends observed in each plot, along with approximate data points. Note that precise values are difficult to extract due to the resolution of the image.
**Row 1 (relu1\_1 to relu5\_1):**
* **relu1\_1:** All lines are relatively flat. γ = 0 (pink) starts around 0.75 and ends around 0.78. γ = 10^-1 (black) starts around 0.75 and ends around 0.77.
* **relu2\_1:** Similar to relu1\_1, lines are relatively flat. γ = 0 (pink) starts around 0.75 and ends around 0.79. γ = 10^-1 (black) starts around 0.75 and ends around 0.77.
* **relu3\_1:** Lines show a slight upward trend. γ = 0 (pink) starts around 0.68 and ends around 0.75. γ = 10^-1 (black) starts around 0.68 and ends around 0.72.
* **relu4\_1:** Lines show a slight upward trend. γ = 0 (pink) starts around 0.68 and ends around 0.75. γ = 10^-1 (black) starts around 0.68 and ends around 0.72.
* **relu5\_1:** Lines show a slight upward trend. γ = 0 (pink) starts around 0.68 and ends around 0.75. γ = 10^-1 (black) starts around 0.68 and ends around 0.72.
**Row 2 (relu1\_2 to relu5\_2):**
* **relu1\_2:** Lines are relatively flat. γ = 0 (pink) starts around 0.75 and ends around 0.78. γ = 10^-1 (black) starts around 0.75 and ends around 0.77.
* **relu2\_2:** Lines are relatively flat. γ = 0 (pink) starts around 0.75 and ends around 0.79. γ = 10^-1 (black) starts around 0.75 and ends around 0.77.
* **relu3\_2:** Lines show a slight upward trend. γ = 0 (pink) starts around 0.68 and ends around 0.75. γ = 10^-1 (black) starts around 0.68 and ends around 0.72.
* **relu4\_2:** Lines show a slight upward trend. γ = 0 (pink) starts around 0.68 and ends around 0.75. γ = 10^-1 (black) starts around 0.68 and ends around 0.72.
* **relu5\_2:** Lines show a slight upward trend. γ = 0 (pink) starts around 0.68 and ends around 0.75. γ = 10^-1 (black) starts around 0.68 and ends around 0.72.
**Row 3 (relu1\_3 to relu5\_3):**
* **relu1\_3:** Lines are relatively flat. γ = 0 (pink) starts around 0.75 and ends around 0.78. γ = 10^-1 (black) starts around 0.75 and ends around 0.77.
* **relu2\_3:** Lines are relatively flat. γ = 0 (pink) starts around 0.75 and ends around 0.79. γ = 10^-1 (black) starts around 0.75 and ends around 0.77.
* **relu3\_3:** Lines show a slight upward trend. γ = 0 (pink) starts around 0.68 and ends around 0.75. γ = 10^-1 (black) starts around 0.68 and ends around 0.72.
* **relu4\_3:** Lines show a slight upward trend. γ = 0 (pink) starts around 0.68 and ends around 0.75. γ = 10^-1 (black) starts around 0.68 and ends around 0.72.
* **relu5\_3:** Lines show a slight upward trend. γ = 0 (pink) starts around 0.68 and ends around 0.75. γ = 10^-1 (black) starts around 0.68 and ends around 0.72.
### Key Observations
* The regularization parameter γ = 0 (pink) generally exhibits the highest test accuracy across all ReLU configurations.
* Higher values of γ (e.g., γ = 10^-1) tend to result in lower test accuracy.
* The impact of the number of classes on test accuracy is minimal for most configurations, with lines remaining relatively flat.
* The shaded areas around the lines indicate some variability in the test accuracy for each regularization parameter.
* There is a slight upward trend in test accuracy as the number of classes increases for some configurations, but the effect is small.
### Interpretation
The data suggests that using no regularization (γ = 0) generally leads to the best performance in terms of test accuracy for these ReLU network configurations. Applying regularization, even at moderate levels (γ = 10^-1), tends to decrease performance. The relatively flat lines indicate that the number of classes does not significantly impact the model's ability to generalize, at least within the range of 1 to 64 classes tested. The small variability indicated by the shaded areas suggests that the results are relatively consistent.
The consistent performance of γ = 0 across different ReLU layers suggests that the network architecture itself may not be the primary factor influencing performance in this scenario. The regularization parameter appears to be the dominant factor. The lack of a strong trend with the number of classes could indicate that the dataset is not complex enough to require a large number of classes for effective learning, or that the network capacity is sufficient to handle the given number of classes without overfitting.