## Line Graphs: Training Reward and KL Divergence vs Training Steps (sync_interval = 20)
### Overview
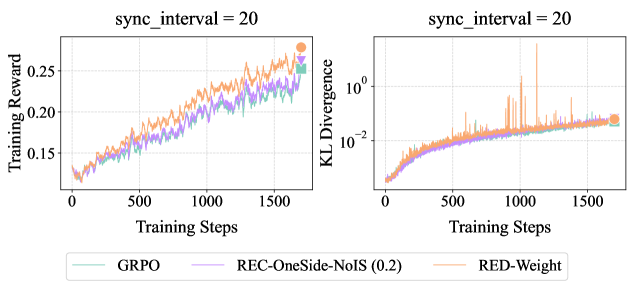
Two line graphs are presented side-by-side, both labeled with `sync_interval = 20`. The left graph tracks **Training Reward** (y-axis) against **Training Steps** (x-axis), while the right graph tracks **KL Divergence** (y-axis) against the same x-axis. Three methods are compared: **GRPO** (green), **REC-OneSide-NoIS (0.2)** (purple), and **RED-Weight** (orange). Both graphs show trends over 1500 training steps.
---
### Components/Axes
- **Left Graph (Training Reward)**:
- **X-axis**: Training Steps (0 to 1500, linear scale).
- **Y-axis**: Training Reward (0 to 0.25, linear scale).
- **Legend**: Located at the bottom, mapping colors to methods:
- Green: GRPO
- Purple: REC-OneSide-NoIS (0.2)
- Orange: RED-Weight
- **Right Graph (KL Divergence)**:
- **X-axis**: Training Steps (0 to 1500, linear scale).
- **Y-axis**: KL Divergence (10⁻² to 10⁰, logarithmic scale).
- **Legend**: Same as the left graph.
---
### Detailed Analysis
#### Left Graph (Training Reward)
- **GRPO (green)**: Starts near 0.12, increases steadily to ~0.24 by 1500 steps. Smooth upward trend with minor fluctuations.
- **REC-OneSide-NoIS (0.2) (purple)**: Similar trajectory to GRPO, peaking at ~0.23. Slightly more volatile but closely aligned with GRPO.
- **RED-Weight (orange)**: Outperforms others, reaching ~0.26 by 1500 steps. Consistent upward slope with minor noise.
#### Right Graph (KL Divergence)
- **GRPO (green)**: Begins at ~10⁻², rises to ~10⁻¹ by 1500 steps. Gradual increase with occasional spikes.
- **REC-OneSide-NoIS (0.2) (purple)**: Mirrors GRPO’s trend, ending near ~10⁻¹. Slightly smoother than GRPO.
- **RED-Weight (orange)**: Starts at ~10⁻², peaks at ~10⁻¹ by 1500 steps. More pronounced fluctuations, including sharp spikes (e.g., ~10⁻¹⁵ at ~1000 steps).
---
### Key Observations
1. **Training Reward**:
- All methods improve over time, but **RED-Weight** achieves the highest reward (~0.26 vs. ~0.24 for others).
- GRPO and REC-OneSide-NoIS perform similarly, with GRPO slightly edging ahead in later steps.
2. **KL Divergence**:
- All methods show increasing divergence, indicating growing deviation from a target distribution.
- **RED-Weight** exhibits the highest divergence (~10⁻¹) and most instability (spikes), suggesting potential overfitting or optimization challenges.
- GRPO and REC-OneSide-NoIS demonstrate more stable divergence patterns.
3. **Sync Interval**:
- Both graphs share `sync_interval = 20`, implying synchronized updates every 20 steps. This may influence the observed trends in reward and divergence.
---
### Interpretation
- **Performance Trade-off**: RED-Weight achieves the highest training reward but at the cost of higher KL divergence, suggesting it may prioritize reward maximization over distributional stability.
- **Stability vs. Reward**: GRPO and REC-OneSide-NoIS balance reward and divergence better, with smoother KL curves. Their lower divergence might indicate more robust generalization.
- **Spike Analysis**: The sharp KL divergence spikes in RED-Weight (e.g., ~10⁻¹⁵ at ~1000 steps) could reflect transient instability during training, possibly due to aggressive optimization or parameter updates.
- **Sync Interval Impact**: The fixed `sync_interval = 20` might introduce periodic synchronization effects, visible in the periodic fluctuations of all lines.
---
### Spatial Grounding & Verification
- **Legend Placement**: Bottom-center, clearly aligned with both graphs. Colors match line colors exactly (green, purple, orange).
- **Axis Consistency**: Both graphs share identical x-axis labels and scales, ensuring direct comparability.
- **Trend Verification**: Visual inspection confirms RED-Weight’s higher reward and divergence align with its orange line’s position in both graphs.
---
### Content Details
- **Training Reward Values**:
- GRPO: ~0.12 → 0.24
- REC-OneSide-NoIS: ~0.12 → 0.23
- RED-Weight: ~0.12 → 0.26
- **KL Divergence Values**:
- GRPO: ~10⁻² → 10⁻¹
- REC-OneSide-NoIS: ~10⁻² → 10⁻¹
- RED-Weight: ~10⁻² → 10⁻¹ (with spikes to ~10⁻¹⁵).
---
### Final Notes
The graphs highlight a trade-off between reward maximization and distributional stability. RED-Weight’s superior reward comes with higher divergence, while GRPO and REC-OneSide-NoIS offer more balanced performance. The sync interval’s role in these dynamics warrants further investigation, particularly its impact on spike patterns in KL divergence.