## Chart: Training Reward and KL Divergence vs. Training Steps
### Overview
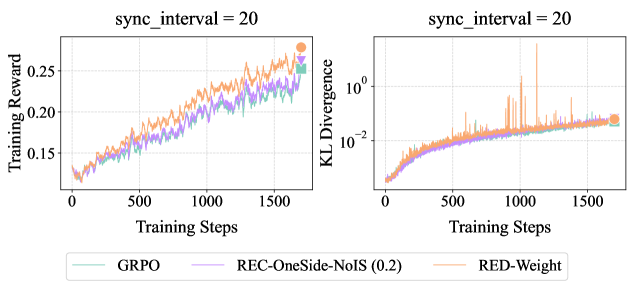
The image presents two line charts side-by-side. The left chart displays "Training Reward" versus "Training Steps," while the right chart shows "KL Divergence" (on a logarithmic scale) versus "Training Steps." Both charts compare three different algorithms: GRPO, REC-OneSide-NoIS (0.2), and RED-Weight, with a sync interval of 20.
### Components/Axes
**Left Chart (Training Reward):**
* **Title:** Training Reward vs Training Steps, sync_interval = 20
* **Y-axis:** Training Reward, linear scale from 0.15 to 0.25, with tick marks at 0.15, 0.20, and 0.25.
* **X-axis:** Training Steps, linear scale from 0 to 1500, with tick marks at 0, 500, 1000, and 1500.
* **Legend (bottom):**
* GRPO (light green) - square marker
* REC-OneSide-NoIS (0.2) (light purple) - downward triangle marker
* RED-Weight (light orange) - circle marker
**Right Chart (KL Divergence):**
* **Title:** KL Divergence vs Training Steps, sync_interval = 20
* **Y-axis:** KL Divergence, logarithmic scale from 10^-2 to 10^0 (0.01 to 1), with tick marks at 10^-2 and 10^0.
* **X-axis:** Training Steps, linear scale from 0 to 1500, with tick marks at 0, 500, 1000, and 1500.
* **Legend (bottom):**
* GRPO (light green)
* REC-OneSide-NoIS (0.2) (light purple)
* RED-Weight (light orange)
### Detailed Analysis
**Left Chart (Training Reward):**
* **GRPO (light green):** Starts at approximately 0.125 and generally increases to around 0.225 by 1500 training steps.
* **REC-OneSide-NoIS (0.2) (light purple):** Starts at approximately 0.125 and increases to around 0.23 by 1500 training steps.
* **RED-Weight (light orange):** Starts at approximately 0.125 and increases to around 0.26 by 1500 training steps.
**Right Chart (KL Divergence):**
* **GRPO (light green):** Starts near 0.002 and increases to approximately 0.015 by 1500 training steps.
* **REC-OneSide-NoIS (0.2) (light purple):** Starts near 0.002 and increases to approximately 0.015 by 1500 training steps.
* **RED-Weight (light orange):** Starts near 0.002 and increases to approximately 0.015 by 1500 training steps, with several large spikes throughout the training steps.
### Key Observations
* In the Training Reward chart, RED-Weight consistently achieves a slightly higher reward than GRPO and REC-OneSide-NoIS (0.2).
* In the KL Divergence chart, all three algorithms show a similar increasing trend, but RED-Weight exhibits significantly more volatility with large spikes.
### Interpretation
The charts suggest that, with a sync interval of 20, RED-Weight achieves a higher training reward compared to GRPO and REC-OneSide-NoIS (0.2). However, this comes at the cost of increased KL divergence volatility, potentially indicating instability or exploration issues during training. GRPO and REC-OneSide-NoIS (0.2) show similar performance in both training reward and KL divergence, suggesting they might offer more stable training dynamics. The logarithmic scale on the KL Divergence chart highlights the relative differences in divergence, emphasizing the spikes observed in RED-Weight.