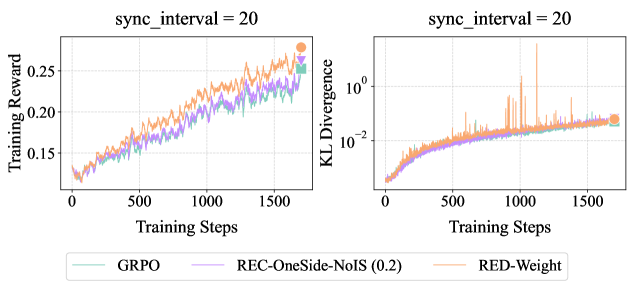
## Charts: Training Reward and KL Divergence vs. Training Steps
### Overview
The image presents two line charts, side-by-side, both with the title "sync_interval = 20". The left chart displays "Training Reward" against "Training Steps", while the right chart shows "KL Divergence" against "Training Steps". Both charts share the same x-axis (Training Steps) and display data for three different algorithms: GRPO, REC-OneSide-NoIS (0.2), and RED-Weight. A legend is positioned at the bottom of the image, identifying the color-coded lines for each algorithm.
### Components/Axes
* **Left Chart:**
* X-axis: "Training Steps" (Scale: 0 to 1600, increments of 100)
* Y-axis: "Training Reward" (Scale: 0.14 to 0.26, increments of 0.02, logarithmic scale is not used)
* **Right Chart:**
* X-axis: "Training Steps" (Scale: 0 to 1600, increments of 100)
* Y-axis: "KL Divergence" (Scale: 1e-2 to 1e0, logarithmic scale)
* **Legend:** Located at the bottom center of the image.
* GRPO: Light Green
* REC-OneSide-NoIS (0.2): Purple
* RED-Weight: Orange
### Detailed Analysis or Content Details
**Left Chart (Training Reward):**
* **GRPO (Light Green):** The line starts at approximately 0.155 at 0 Training Steps and generally slopes upward, reaching approximately 0.245 at 1600 Training Steps. There are fluctuations, but the overall trend is positive.
* **REC-OneSide-NoIS (0.2) (Purple):** The line begins at approximately 0.15 at 0 Training Steps and also slopes upward, reaching approximately 0.25 at 1600 Training Steps. It exhibits more pronounced fluctuations than GRPO.
* **RED-Weight (Orange):** The line starts at approximately 0.15 at 0 Training Steps and increases to approximately 0.26 at 1600 Training Steps. It shows the most significant fluctuations of the three algorithms.
**Right Chart (KL Divergence):**
* **GRPO (Light Green):** The line starts at approximately 0.02 at 0 Training Steps and decreases to approximately 0.01 at 1600 Training Steps. It remains relatively stable, with minor fluctuations.
* **REC-OneSide-NoIS (0.2) (Purple):** The line begins at approximately 0.02 at 0 Training Steps and decreases to approximately 0.01 at 1600 Training Steps. It is similar to GRPO in its trend and stability.
* **RED-Weight (Orange):** The line starts at approximately 0.02 at 0 Training Steps and initially increases sharply to approximately 0.1 at 200 Training Steps, then fluctuates significantly between approximately 0.01 and 0.08 before decreasing to approximately 0.02 at 1600 Training Steps. This line exhibits the most volatility.
### Key Observations
* All three algorithms show an increasing trend in Training Reward over time.
* RED-Weight consistently achieves the highest Training Reward, but also exhibits the greatest fluctuations.
* GRPO and REC-OneSide-NoIS (0.2) have similar Training Reward curves.
* KL Divergence decreases over time for GRPO and REC-OneSide-NoIS (0.2), indicating convergence.
* RED-Weight exhibits a highly unstable KL Divergence, with a large spike early in training.
### Interpretation
The charts demonstrate the performance of three reinforcement learning algorithms (GRPO, REC-OneSide-NoIS (0.2), and RED-Weight) during training. The increasing Training Reward suggests that all algorithms are learning to improve their performance. The higher Training Reward achieved by RED-Weight indicates that it may be the most effective algorithm, but its high KL Divergence and fluctuations suggest it may be less stable or prone to overfitting. The lower KL Divergence and more stable curves of GRPO and REC-OneSide-NoIS (0.2) suggest they may be more robust and generalize better. The "sync_interval = 20" indicates that the model parameters are synchronized every 20 training steps, which could influence the observed training dynamics. The spike in RED-Weight's KL Divergence at the beginning of training could indicate a significant update or change in the policy. The logarithmic scale on the KL Divergence chart emphasizes the relative magnitude of the fluctuations in RED-Weight.