\n
## Bar Chart: Mean Accuracy by Mathematical Concept
### Overview
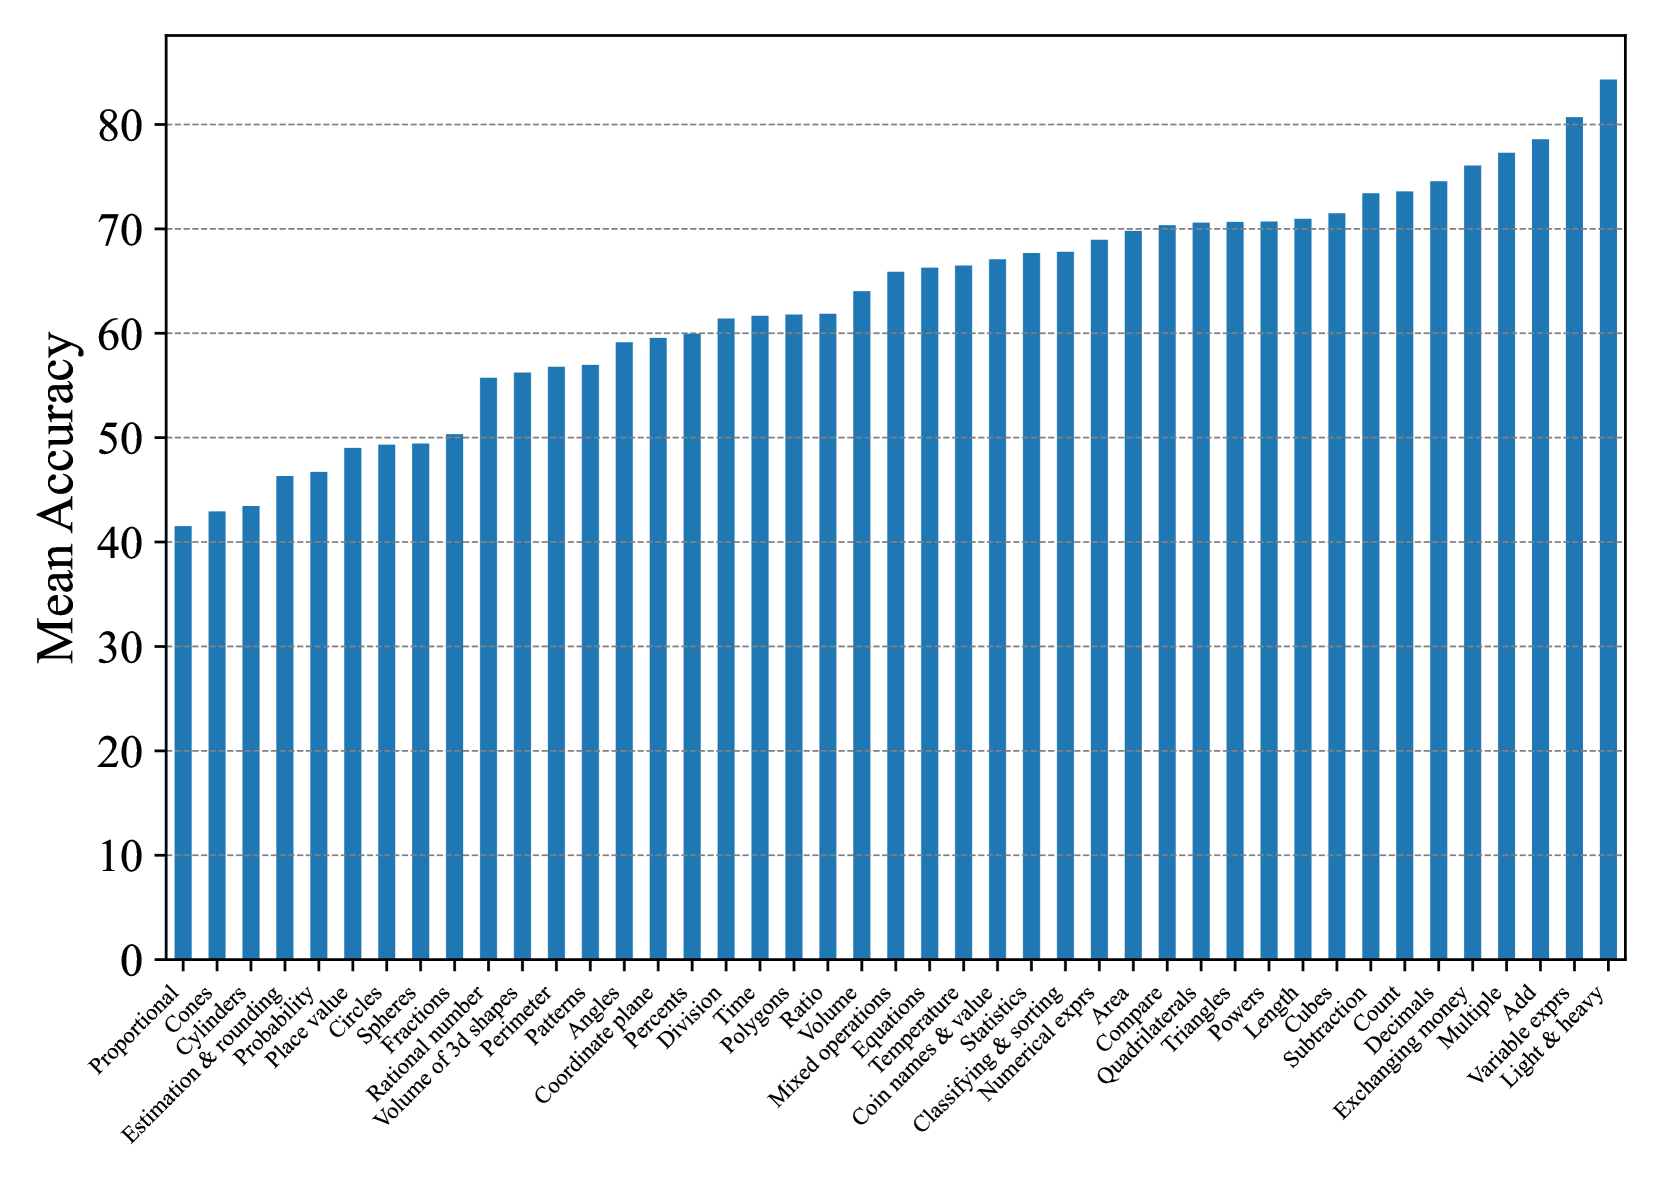
This image presents a bar chart illustrating the mean accuracy scores for various mathematical concepts. The x-axis lists the concepts, and the y-axis represents the mean accuracy, ranging from 0 to 80. Each concept is represented by a single bar, with the height of the bar corresponding to the mean accuracy score.
### Components/Axes
* **X-axis Label:** Mathematical Concepts (listed below)
* **Y-axis Label:** Mean Accuracy
* **Y-axis Scale:** 0 to 80, with increments of 10.
* **Concepts (X-axis):** Proportional, Cones, Estimation & rounding, Probability, Place value, Circles, Spheres, Fractions, Rational number, Volume of 3D shapes, Perimeter, Patterns, Angles, Coordinate Plane, Percents, Division, Polygons, Time, Ratio, Volume, Mixed operations, Equations, Temperature, Coin names & value, Classifying & sorting, Numeric expressions, Area, Compare, Quadrilaterals, Triangles, Length, Cubes, Count, Decimals, Exchanging money, Multiple, Add, Light & heavy.
### Detailed Analysis
The bars represent the mean accuracy for each mathematical concept. The trend is generally upward, with accuracy increasing as you move from left to right across the chart.
Here's a breakdown of approximate accuracy values for each concept (reading from left to right):
* **Proportional:** ~5%
* **Cones:** ~15%
* **Estimation & rounding:** ~20%
* **Probability:** ~25%
* **Place value:** ~30%
* **Circles:** ~35%
* **Spheres:** ~38%
* **Fractions:** ~42%
* **Rational number:** ~45%
* **Volume of 3D shapes:** ~50%
* **Perimeter:** ~52%
* **Patterns:** ~55%
* **Angles:** ~57%
* **Coordinate Plane:** ~58%
* **Percents:** ~60%
* **Division:** ~62%
* **Polygons:** ~64%
* **Time:** ~65%
* **Ratio:** ~66%
* **Volume:** ~67%
* **Mixed operations:** ~68%
* **Equations:** ~69%
* **Temperature:** ~70%
* **Coin names & value:** ~71%
* **Classifying & sorting:** ~72%
* **Numeric expressions:** ~73%
* **Area:** ~74%
* **Compare:** ~75%
* **Quadrilaterals:** ~76%
* **Triangles:** ~77%
* **Length:** ~78%
* **Cubes:** ~79%
* **Count:** ~79%
* **Decimals:** ~79%
* **Exchanging money:** ~80%
* **Multiple:** ~80%
* **Add:** ~80%
* **Light & heavy:** ~80%
### Key Observations
* The lowest mean accuracy is observed for "Proportional" (~5%).
* The highest mean accuracies are observed for "Exchanging money", "Multiple", "Add", and "Light & heavy" (~80%).
* There's a significant jump in accuracy between "Rational number" (~45%) and "Volume of 3D shapes" (~50%).
* Accuracy generally increases with the complexity of the mathematical concept, but there are some exceptions.
### Interpretation
The data suggests that students generally perform better on more concrete and practical mathematical concepts (like "Exchanging money" and "Add") compared to more abstract or complex ones (like "Proportional" and "Cones"). The upward trend indicates that as students progress through different mathematical topics, their overall accuracy tends to improve. The jump in accuracy around "Volume of 3D shapes" might indicate a shift in the curriculum or a foundational concept being mastered. The relatively low accuracy for "Proportional" suggests this concept may require additional focus or different teaching strategies. The chart provides a valuable overview of student performance across a range of mathematical concepts, which can be used to inform instructional decisions and identify areas where students may need additional support.