## Line Chart: pass@1-with-n-queries
### Overview
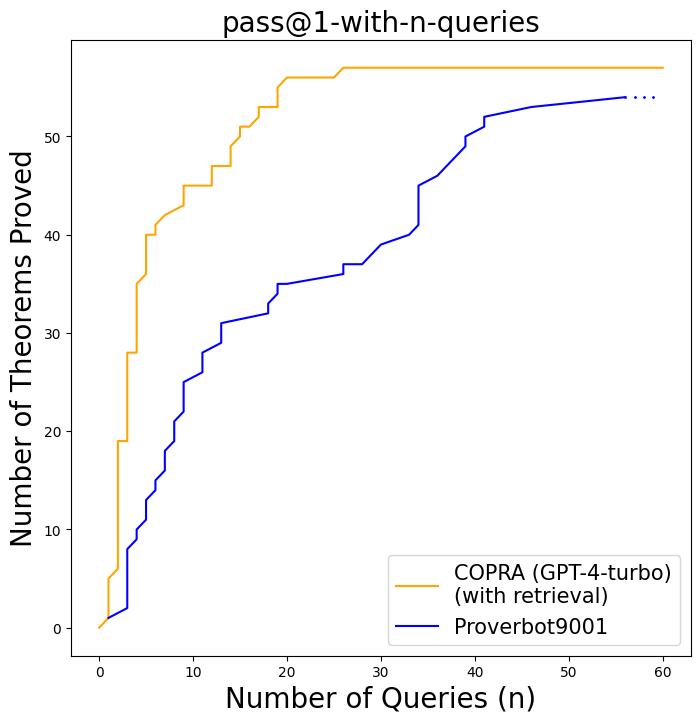
The image is a line chart comparing the performance of two theorem proving systems, COPRA (GPT-4-turbo) with retrieval and Proverbot9001, based on the number of theorems proved as a function of the number of queries. The x-axis represents the number of queries (n), and the y-axis represents the number of theorems proved.
### Components/Axes
* **Title:** pass@1-with-n-queries
* **X-axis:**
* Label: Number of Queries (n)
* Scale: 0 to 60, with tick marks at intervals of 10 (0, 10, 20, 30, 40, 50, 60)
* **Y-axis:**
* Label: Number of Theorems Proved
* Scale: 0 to 50, with tick marks at intervals of 10 (0, 10, 20, 30, 40, 50)
* **Legend:** Located in the bottom-right corner of the chart.
* COPRA (GPT-4-turbo) (with retrieval): Represented by a goldenrod line.
* Proverbot9001: Represented by a dark blue line.
### Detailed Analysis
* **COPRA (GPT-4-turbo) (with retrieval) (Goldenrod Line):**
* Trend: The line generally slopes upward, indicating an increase in the number of theorems proved as the number of queries increases. The line plateaus around 57 theorems proved.
* Data Points:
* At approximately 2 queries, around 20 theorems are proved.
* At approximately 8 queries, around 40 theorems are proved.
* At approximately 18 queries, around 55 theorems are proved.
* The line plateaus at approximately 57 theorems proved after 20 queries.
* **Proverbot9001 (Dark Blue Line):**
* Trend: The line generally slopes upward, indicating an increase in the number of theorems proved as the number of queries increases. The line appears to be approaching a plateau around 54 theorems proved.
* Data Points:
* At 2 queries, approximately 2 theorems are proved.
* At 10 queries, approximately 25 theorems are proved.
* At 20 queries, approximately 35 theorems are proved.
* At 40 queries, approximately 50 theorems are proved.
* At 60 queries, approximately 54 theorems are proved.
### Key Observations
* COPRA (GPT-4-turbo) (with retrieval) proves theorems more rapidly with fewer queries compared to Proverbot9001.
* COPRA (GPT-4-turbo) (with retrieval) plateaus at a higher number of theorems proved compared to Proverbot9001 within the observed query range.
* Proverbot9001 shows a more gradual increase in the number of theorems proved as the number of queries increases.
### Interpretation
The chart demonstrates that COPRA (GPT-4-turbo) (with retrieval) is more efficient at proving theorems compared to Proverbot9001, especially with a smaller number of queries. The plateauing of both lines suggests that there may be a limit to the number of theorems that can be proved with the given query setup or that additional queries beyond a certain point do not significantly improve performance. The difference in the initial slope and plateau level indicates that COPRA (GPT-4-turbo) (with retrieval) has a more effective strategy for theorem proving within the tested parameters.