## Line Chart: Theorem Proving Performance
### Overview
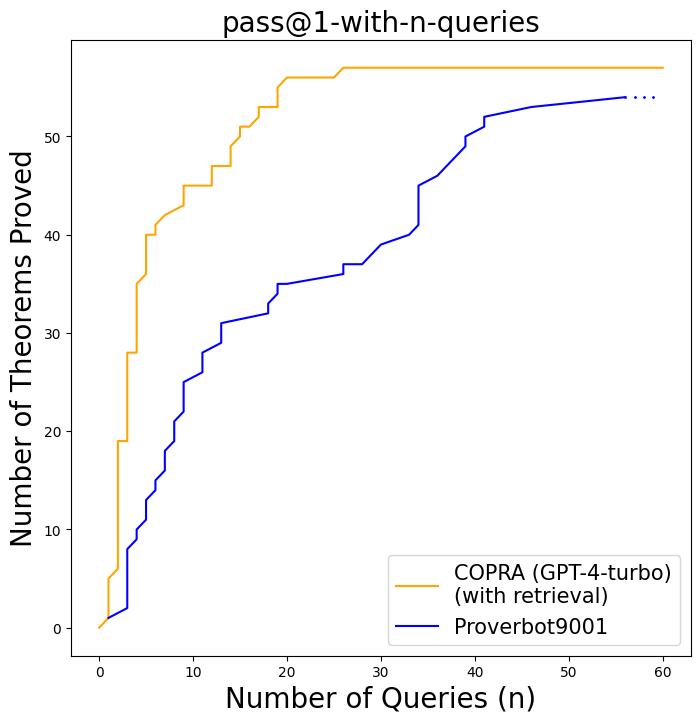
This line chart compares the performance of two theorem proving systems, COPRAGPT-4-turbo (with retrieval) and Proverbot9001, based on the number of theorems proved as a function of the number of queries submitted. The chart title indicates the metric being evaluated is "pass@1-with-n-queries".
### Components/Axes
* **X-axis:** "Number of Queries (n)", ranging from 0 to 60, with tick marks at intervals of 10.
* **Y-axis:** "Number of Theorems Proved", ranging from 0 to 60, with tick marks at intervals of 10.
* **Lines:**
* COPRAGPT-4-turbo (with retrieval) - represented by a solid orange line.
* Proverbot9001 - represented by a solid blue line.
* **Legend:** Located in the bottom-right corner of the chart.
* **Title:** "pass@1-with-n-queries" positioned at the top-center of the chart.
### Detailed Analysis
**COPRAGPT-4-turbo (with retrieval) - Orange Line:**
The orange line starts at approximately 0 theorems proved at 0 queries. It exhibits a steep upward slope initially, reaching approximately 15 theorems proved at around 8 queries. The slope gradually decreases, leveling off around 55-58 theorems proved between 25 and 60 queries. There is a plateau between approximately 20 and 40 queries where the number of theorems proved remains relatively constant.
* (0, 0)
* (5, ~2)
* (10, ~15)
* (15, ~25)
* (20, ~35)
* (25, ~45)
* (30, ~48)
* (35, ~50)
* (40, ~52)
* (45, ~54)
* (50, ~55)
* (60, ~58)
**Proverbot9001 - Blue Line:**
The blue line also starts at approximately 0 theorems proved at 0 queries. It has a more gradual initial slope compared to the orange line, reaching approximately 8 theorems proved at around 8 queries. The slope increases more noticeably between 8 and 20 queries, reaching approximately 32 theorems proved at 20 queries. The slope then decreases, and the line plateaus around 52-54 theorems proved between 40 and 60 queries. The line has more pronounced step-like increases than the orange line.
* (0, 0)
* (5, ~3)
* (10, ~8)
* (15, ~18)
* (20, ~32)
* (25, ~38)
* (30, ~42)
* (35, ~46)
* (40, ~50)
* (45, ~52)
* (50, ~53)
* (60, ~54)
### Key Observations
* COPRAGPT-4-turbo (with retrieval) consistently proves more theorems than Proverbot9001 across the entire range of queries.
* Both systems exhibit diminishing returns as the number of queries increases, with the rate of theorem proving slowing down.
* Proverbot9001 shows more discrete jumps in the number of theorems proved, suggesting it may solve theorems in batches or have a more step-wise learning process.
* The orange line (COPRAGPT-4-turbo) has a smoother curve, indicating a more continuous improvement in performance.
### Interpretation
The chart demonstrates that COPRAGPT-4-turbo (with retrieval) outperforms Proverbot9001 in theorem proving, as measured by the number of theorems proved per query. The "pass@1-with-n-queries" metric suggests that the systems are evaluated on their ability to correctly prove theorems given a single attempt per query. The diminishing returns observed in both systems indicate that there is a limit to the effectiveness of simply increasing the number of queries. The differences in the smoothness of the curves suggest that the two systems employ different strategies for theorem proving. The step-like increases in Proverbot9001's performance could be due to the system learning from its mistakes and making significant progress in batches. The plateauing of both lines suggests that the systems are approaching their maximum performance level within the tested query range. This data could be used to compare the efficiency and effectiveness of different theorem proving approaches and to identify areas for improvement.