## Line Graph: pass@1-with-n-queries
### Overview
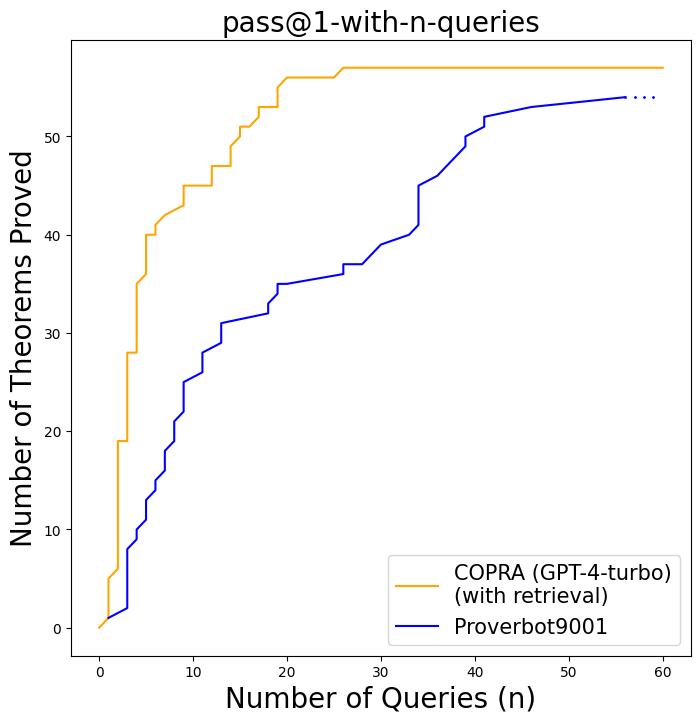
The image is a line graph comparing the performance of two systems, COPRA (GPT-4-turbo) with retrieval and Proverbot9001, in terms of the number of theorems proved as the number of queries increases. The graph spans 0 to 60 queries on the x-axis and 0 to 55 theorems proved on the y-axis.
### Components/Axes
- **Title**: "pass@1-with-n-queries" (centered at the top).
- **X-axis**: "Number of Queries (n)" with values from 0 to 60 in increments of 10.
- **Y-axis**: "Number of Theorems Proved" with values from 0 to 55 in increments of 10.
- **Legend**: Located in the bottom-right corner, with:
- **Orange solid line**: "COPRA (GPT-4-turbo) (with retrieval)".
- **Blue dotted line**: "Proverbot9001".
### Detailed Analysis
1. **COPRA (GPT-4-turbo) (with retrieval)**:
- Starts at (0, 0) and rises sharply, reaching ~55 theorems proved by ~20 queries.
- Plateaus at ~55 theorems proved for queries ≥20.
- Key data points:
- ~15 theorems at 10 queries.
- ~35 theorems at 20 queries.
- ~55 theorems at 30+ queries.
2. **Proverbot9001**:
- Starts at (0, 0) and rises gradually, reaching ~50 theorems proved by ~50 queries.
- Plateaus at ~50 theorems proved for queries ≥50.
- Key data points:
- ~10 theorems at 10 queries.
- ~30 theorems at 30 queries.
- ~50 theorems at 50+ queries.
### Key Observations
- **COPRA outperforms Proverbot9001** in the early stages, achieving ~55 theorems by 20 queries compared to Proverbot9001’s ~30 theorems at the same query count.
- **Diminishing returns** are evident for both systems after ~20 (COPRA) and ~50 (Proverbot9001) queries.
- **Proverbot9001’s slower ascent** suggests higher computational/resource costs per query compared to COPRA.
### Interpretation
The graph demonstrates that **COPRA (GPT-4-turbo) with retrieval** is significantly more efficient at proving theorems with fewer queries, making it preferable for scenarios requiring rapid results. However, **Proverbot9001** maintains a steadier performance over a larger query range, potentially indicating robustness in handling complex or extended tasks. The plateauing trends imply that both systems face inherent limitations in scalability beyond certain query thresholds. This data could guide decisions in resource allocation, system selection, or algorithm optimization for theorem-proving applications.