## Flowchart Diagram: Branching Process with Cyclic Paths
### Overview
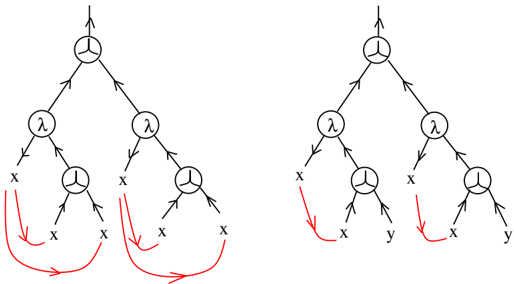
The image contains two identical hierarchical diagrams with branching nodes and directional arrows. Both diagrams feature a root node at the top, followed by two intermediate nodes labeled λ, which split into terminal nodes. The left diagram shows cyclic paths between terminal nodes labeled "x," while the right diagram replaces one terminal node with "y" and introduces a mixed cyclic path between "x" and "y."
### Components/Axes
- **Nodes**:
- **Root Node**: Unlabeled circle at the top.
- **Intermediate Nodes**: Two nodes labeled λ, positioned symmetrically below the root.
- **Terminal Nodes**:
- Left Diagram: Four terminal nodes labeled "x" (two under each λ).
- Right Diagram: Three terminal nodes labeled "x" and one labeled "y" (one under each λ).
- **Special Nodes**: Two nodes with a circle containing two inward-pointing arrows (likely representing feedback or cyclic states).
- **Arrows**:
- Black arrows indicate primary flow direction (top-to-bottom, left-to-right).
- Red arrows highlight cyclic paths:
- Left Diagram: Two loops connecting terminal "x" nodes.
- Right Diagram: One loop connecting "x" and "y" nodes.
### Detailed Analysis
1. **Left Diagram**:
- Root → λ₁ → x₁ → x₃ (via cyclic loop).
- Root → λ₁ → x₂ → x₄ (via cyclic loop).
- Root → λ₂ → x₅ → x₇ (via cyclic loop).
- Root → λ₂ → x₆ → x₈ (via cyclic loop).
2. **Right Diagram**:
- Root → λ₁ → x₁ → y₁ (no loop).
- Root → λ₁ → x₂ → x₄ (via cyclic loop).
- Root → λ₂ → x₅ → y₂ (no loop).
- Root → λ₂ → x₆ → x₈ (via cyclic loop).
### Key Observations
- The left diagram emphasizes self-referential cycles within "x" nodes.
- The right diagram introduces "y" as an alternative terminal state, breaking one cyclic path.
- Red arrows are positioned at the bottom of each diagram, emphasizing terminal-node interactions.
### Interpretation
The diagrams likely represent decision trees or state machines where:
- **λ Nodes**: Act as decision points or transformation stages.
- **Cyclic Paths (Red Arrows)**: Indicate feedback loops or recurring processes.
- **x vs. y Nodes**: Suggest divergent outcomes or states, with "y" representing a terminal or alternative state.
The left diagram may model a system where "x" states persistently loop, while the right diagram introduces "y" as a potential exit or resolution state. The absence of numerical data implies a qualitative representation of process flow rather than quantitative analysis.