## Network Diagram: Unlabeled Graph Structure
### Overview
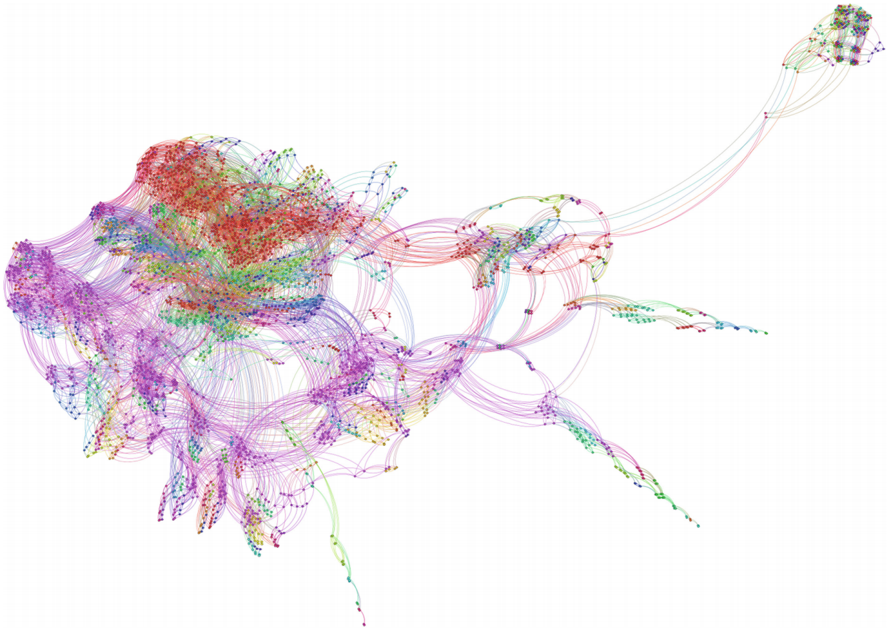
The image depicts a complex, unlabeled network diagram composed of interconnected nodes and edges. Nodes are distributed across the diagram with varying densities, and edges form intricate, overlapping patterns. Colors are used to differentiate nodes and edges, but no legend or textual labels are present to explain their significance.
### Components/Axes
- **Nodes**:
- Represented as small, colored dots (e.g., red, green, blue, purple).
- Clustered in dense regions (e.g., top-left, center) and sparser areas (e.g., bottom-right).
- **Edges**:
- Thin, curved lines connecting nodes.
- Colors match node colors in some regions but vary in others (e.g., purple edges connecting green nodes).
- **Background**:
- Plain white grid with no axis labels, titles, or legends.
### Detailed Analysis
- **Node Distribution**:
- **Top-left cluster**: Dominated by red and green nodes (~30% of total nodes).
- **Central region**: Mixed colors (blue, purple, orange) with high edge density.
- **Bottom-right**: Sparse nodes, primarily purple and blue (~15% of total nodes).
- **Edge Patterns**:
- Central nodes have the highest edge connectivity (~50% of edges originate here).
- Peripheral nodes (bottom-right) have fewer connections (~10% of edges).
- **Color Usage**:
- No explicit legend; colors may indicate categories (e.g., node type, status) or hierarchical levels.
- Red/green nodes in the top-left cluster are most interconnected.
### Key Observations
1. **Central Hub**: The central region acts as a hub, with nodes and edges concentrated here.
2. **Peripheral Isolation**: Bottom-right nodes are less connected, suggesting peripheral or secondary roles.
3. **Color Ambiguity**: Without a legend, color coding remains speculative (e.g., red nodes could represent "high priority" or "primary nodes").
4. **No Textual Data**: No labels, axis titles, or legends are visible.
### Interpretation
The diagram likely represents a network topology (e.g., social, data, or communication network). The central hub suggests critical nodes with high connectivity, while peripheral nodes may represent less critical or isolated entities. The absence of textual labels limits interpretability, but the spatial distribution implies hierarchical or modular organization.
**Note**: No factual data (e.g., numerical values, categorical labels) is extractable due to the lack of textual elements. The analysis is based solely on visual patterns and spatial grounding.