## Network Diagram: Complex Interconnected System
### Overview
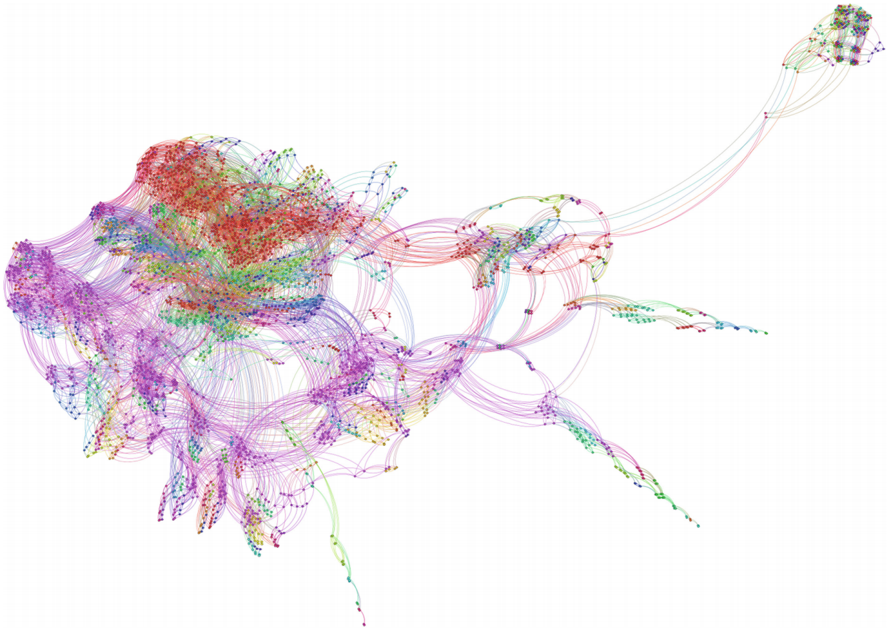
The image presents a complex network diagram with numerous nodes and edges. The nodes are represented by small colored circles, and the edges are represented by curved lines connecting these nodes. The diagram exhibits a high degree of interconnectedness, with a dense cluster of nodes in the central-left region and sparser clusters extending outwards. The colors of the nodes and edges vary, suggesting different categories or properties within the network.
### Components/Axes
* **Nodes:** Represented by small colored circles. The colors include red, green, blue, purple, and variations thereof.
* **Edges:** Represented by curved lines connecting the nodes. The colors of the edges generally match the colors of the nodes they connect.
* **Clusters:** The nodes are grouped into several clusters, with a large, dense cluster in the central-left region and smaller, more dispersed clusters extending towards the right.
### Detailed Analysis
* **Central-Left Cluster:** This is the most prominent feature of the diagram. It is a dense aggregation of nodes with a mix of colors, including red, green, blue, and purple. The edges within this cluster are highly interconnected, forming a complex web.
* **Rightward Extensions:** Several sparser clusters extend from the central-left cluster towards the right. These clusters are less dense and more elongated, with fewer interconnections. The colors of the nodes and edges in these extensions vary, suggesting different sub-networks or pathways.
* **Color Distribution:** The color distribution appears to be non-random. The red nodes seem to be concentrated in the upper part of the central-left cluster, while the purple nodes are more prevalent in the lower part. The green and blue nodes are interspersed throughout the cluster.
* **Isolated Cluster (Top-Right):** There is a distinct, relatively isolated cluster in the top-right corner of the diagram. This cluster is connected to the main network by a few long edges.
### Key Observations
* The network exhibits a core-periphery structure, with a dense core in the central-left region and sparser periphery extending outwards.
* The color-coding of the nodes and edges suggests different categories or properties within the network.
* The isolated cluster in the top-right corner may represent a distinct sub-network or module.
### Interpretation
The network diagram likely represents a complex system with multiple interacting components. The dense central cluster may represent a core set of entities or processes, while the sparser extensions represent peripheral elements or pathways. The color-coding could indicate different types of entities, relationships, or states within the system. The isolated cluster in the top-right corner may represent a specialized module or subsystem. Without further context or a legend, it is difficult to determine the specific meaning of the nodes, edges, and colors. However, the diagram provides a visual representation of the system's structure and interconnectedness, which can be useful for understanding its overall behavior and identifying key areas for further investigation.