## Stacked Bar Chart: Number of Resolved Cases by Model
### Overview
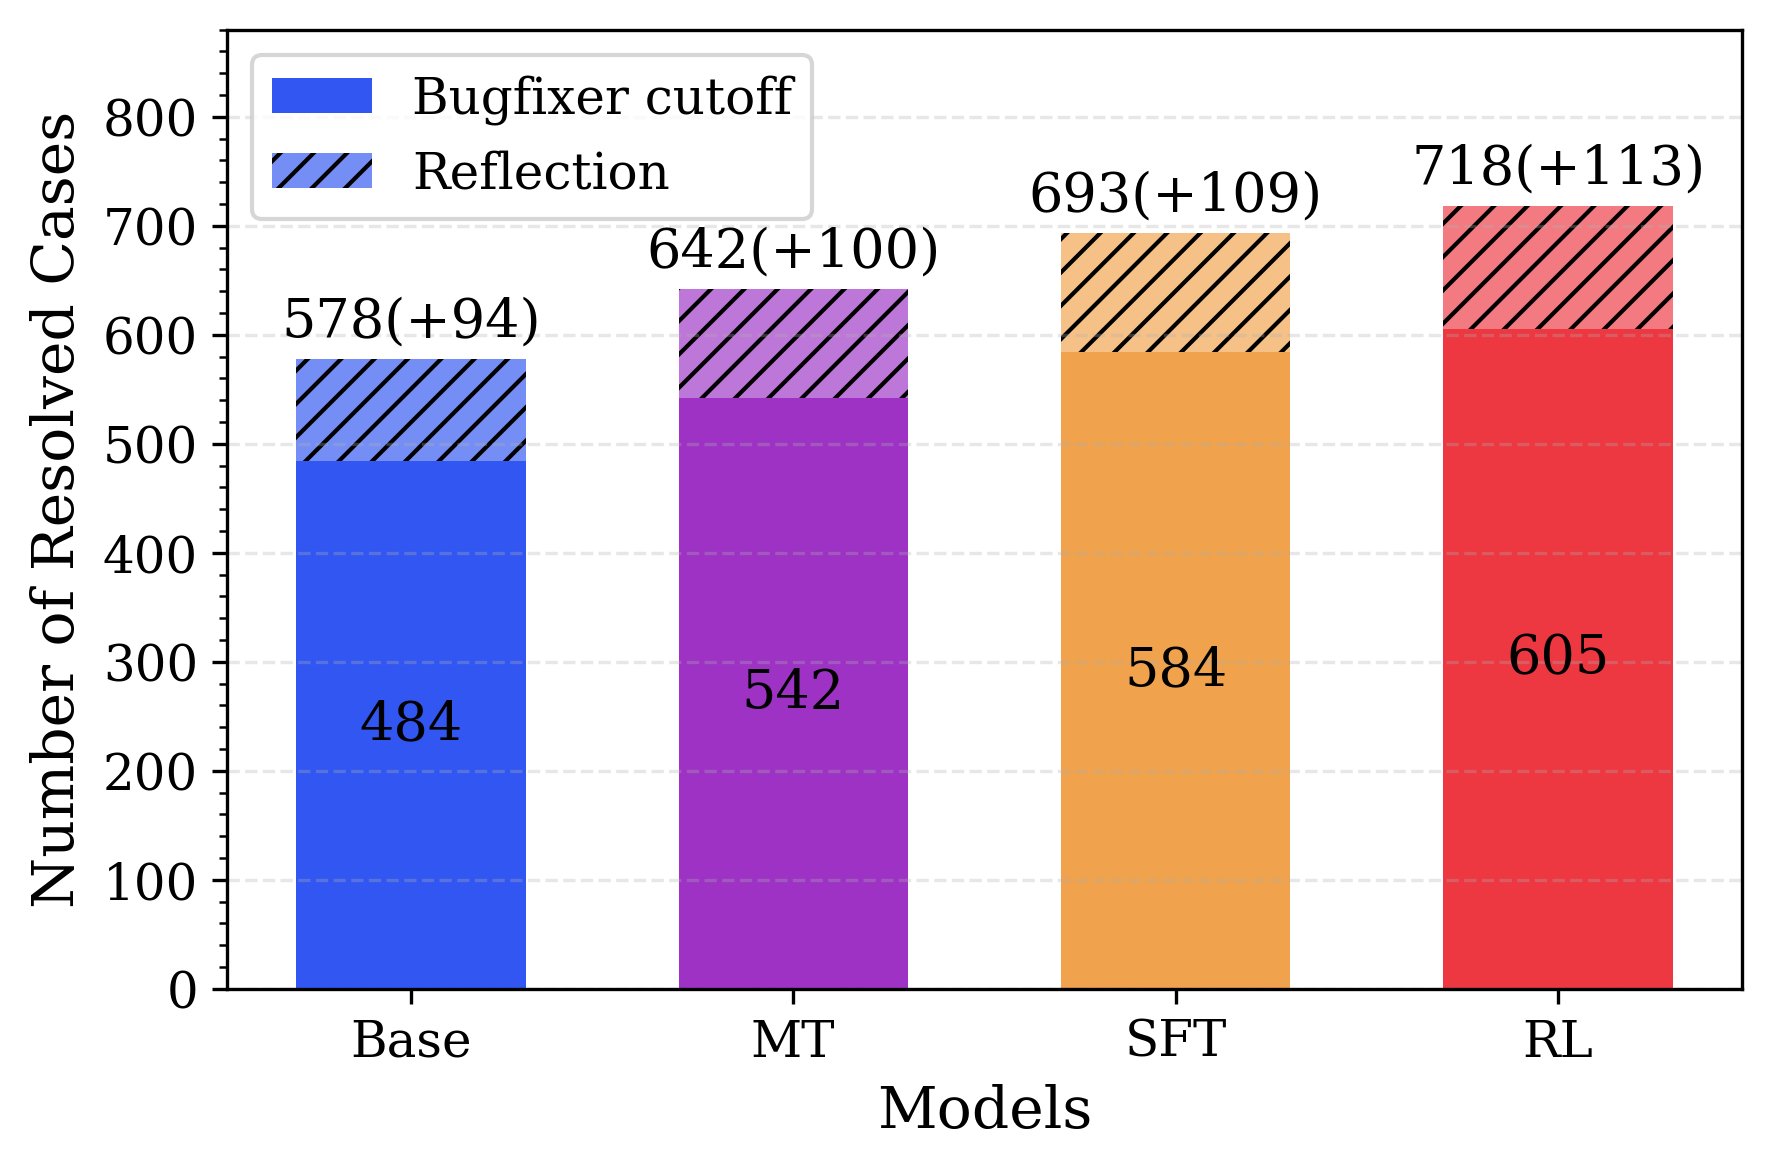
This image is a stacked bar chart comparing the performance of four different machine learning models (Base, MT, SFT, RL) based on the "Number of Resolved Cases." Each bar is divided into two segments representing different phases or methods of resolution: a base "Bugfixer cutoff" and an additional "Reflection" phase. The chart demonstrates a clear progression in performance across the models.
### Components/Axes
**Spatial Layout & Regions:**
* **Top-Left:** A legend enclosed in a rectangular box with a gray border.
* **Left Edge (Y-axis):** Vertical axis with numerical scale and title.
* **Bottom Edge (X-axis):** Horizontal axis with categorical labels and title.
* **Center (Main Chart):** Four distinct stacked bars with embedded numerical data labels. Background features light gray, dashed horizontal grid lines aligned with the major Y-axis ticks.
**Axes Details:**
* **Y-axis (Vertical):**
* **Title:** "Number of Resolved Cases" (oriented vertically, reading bottom to top).
* **Scale:** Ranges from 0 to 800.
* **Markers:** Major tick marks every 100 units (0, 100, 200, 300, 400, 500, 600, 700, 800). Minor tick marks occur every 20 units between the major ticks.
* **X-axis (Horizontal):**
* **Title:** "Models" (centered below the categories).
* **Categories (Left to Right):** "Base", "MT", "SFT", "RL".
**Legend Details:**
* **Solid Blue Rectangle:** Labeled "Bugfixer cutoff".
* **Blue Rectangle with Black Diagonal Hatching:** Labeled "Reflection".
* *Note on Visual Encoding:* While the legend uses blue for both examples, the actual chart uses a distinct color for each model's bar. The true visual differentiator between the two data series is the **texture**: solid color represents "Bugfixer cutoff," and diagonal black hatching over the color represents "Reflection."
### Detailed Analysis
**Trend Verification:**
Visually, there is a strict upward trend moving from left to right. The total height of the bars increases sequentially from Base to RL. Furthermore, the height of the solid bottom portion ("Bugfixer cutoff") also increases sequentially. The hatched top portion ("Reflection") appears to grow slightly thicker as we move right.
**Data Point Extraction:**
Below is the precise extraction of data embedded within and above each bar, moving from left to right. The math (Solid + Hatched = Total) is verified for each column.
1. **Model: Base** (Color: Blue)
* **Bugfixer cutoff (Solid bottom):** 484 (Label centered inside the solid bar)
* **Reflection (Hatched top):** +94
* **Total Resolved:** 578 (Label "578(+94)" positioned above the bar)
* *Visual Check:* The solid bar ends just below the 500 gridline. The top of the bar ends just below the 600 gridline.
2. **Model: MT** (Color: Purple)
* **Bugfixer cutoff (Solid bottom):** 542 (Label centered inside the solid bar)
* **Reflection (Hatched top):** +100
* **Total Resolved:** 642 (Label "642(+100)" positioned above the bar)
* *Visual Check:* The solid bar ends roughly midway between 500 and 600. The top of the bar ends roughly midway between 600 and 700.
3. **Model: SFT** (Color: Orange)
* **Bugfixer cutoff (Solid bottom):** 584 (Label centered inside the solid bar)
* **Reflection (Hatched top):** +109
* **Total Resolved:** 693 (Label "693(+109)" positioned above the bar)
* *Visual Check:* The solid bar ends just below the 600 gridline. The top of the bar ends just below the 700 gridline.
4. **Model: RL** (Color: Red)
* **Bugfixer cutoff (Solid bottom):** 605 (Label centered inside the solid bar)
* **Reflection (Hatched top):** +113
* **Total Resolved:** 718 (Label "718(+113)" positioned above the bar)
* *Visual Check:* The solid bar ends just above the 600 gridline. The top of the bar ends just above the 700 gridline.
**Reconstructed Data Table:**
| Model | Bugfixer cutoff (Base Cases) | Reflection (Added Cases) | Total Resolved Cases |
| :--- | :--- | :--- | :--- |
| Base | 484 | 94 | 578 |
| MT | 542 | 100 | 642 |
| SFT | 584 | 109 | 693 |
| RL | 605 | 113 | 718 |
### Key Observations
* **Consistent Improvement:** Every subsequent model iteration (from Base -> MT -> SFT -> RL) yields a higher number of resolved cases in *both* the initial "Bugfixer cutoff" phase and the secondary "Reflection" phase.
* **Highest Performer:** The "RL" model is the most effective, resolving a total of 718 cases.
* **Reflection Efficacy:** The "Reflection" technique consistently adds value across all models. Interestingly, the absolute number of cases resolved by Reflection increases as the base model improves (94 -> 100 -> 109 -> 113).
### Interpretation
The data demonstrates a clear hierarchy of model efficacy in a bug-fixing or problem-resolution context. The progression from "Base" to "MT" (likely Machine Translation or Multi-Task), to "SFT" (Supervised Fine-Tuning), and finally to "RL" (Reinforcement Learning) shows that more advanced training methodologies directly correlate with higher resolution rates.
From a Peircean investigative standpoint, the relationship between the "Bugfixer cutoff" and "Reflection" is highly revealing. "Reflection" (likely a mechanism where the model reviews and corrects its own initial output) is not just a static bonus; its effectiveness scales with the underlying capability of the model. Because the RL model has a better foundational understanding (resolving 605 cases initially compared to the Base model's 484), it is also more capable of successfully critiquing and fixing its own edge-case failures (adding 113 cases via reflection compared to the Base model's 94). This suggests a compounding return on investment when applying advanced prompting/reflection techniques to superior foundational models.