## Bar Chart: Number of Resolved Cases by Model
### Overview
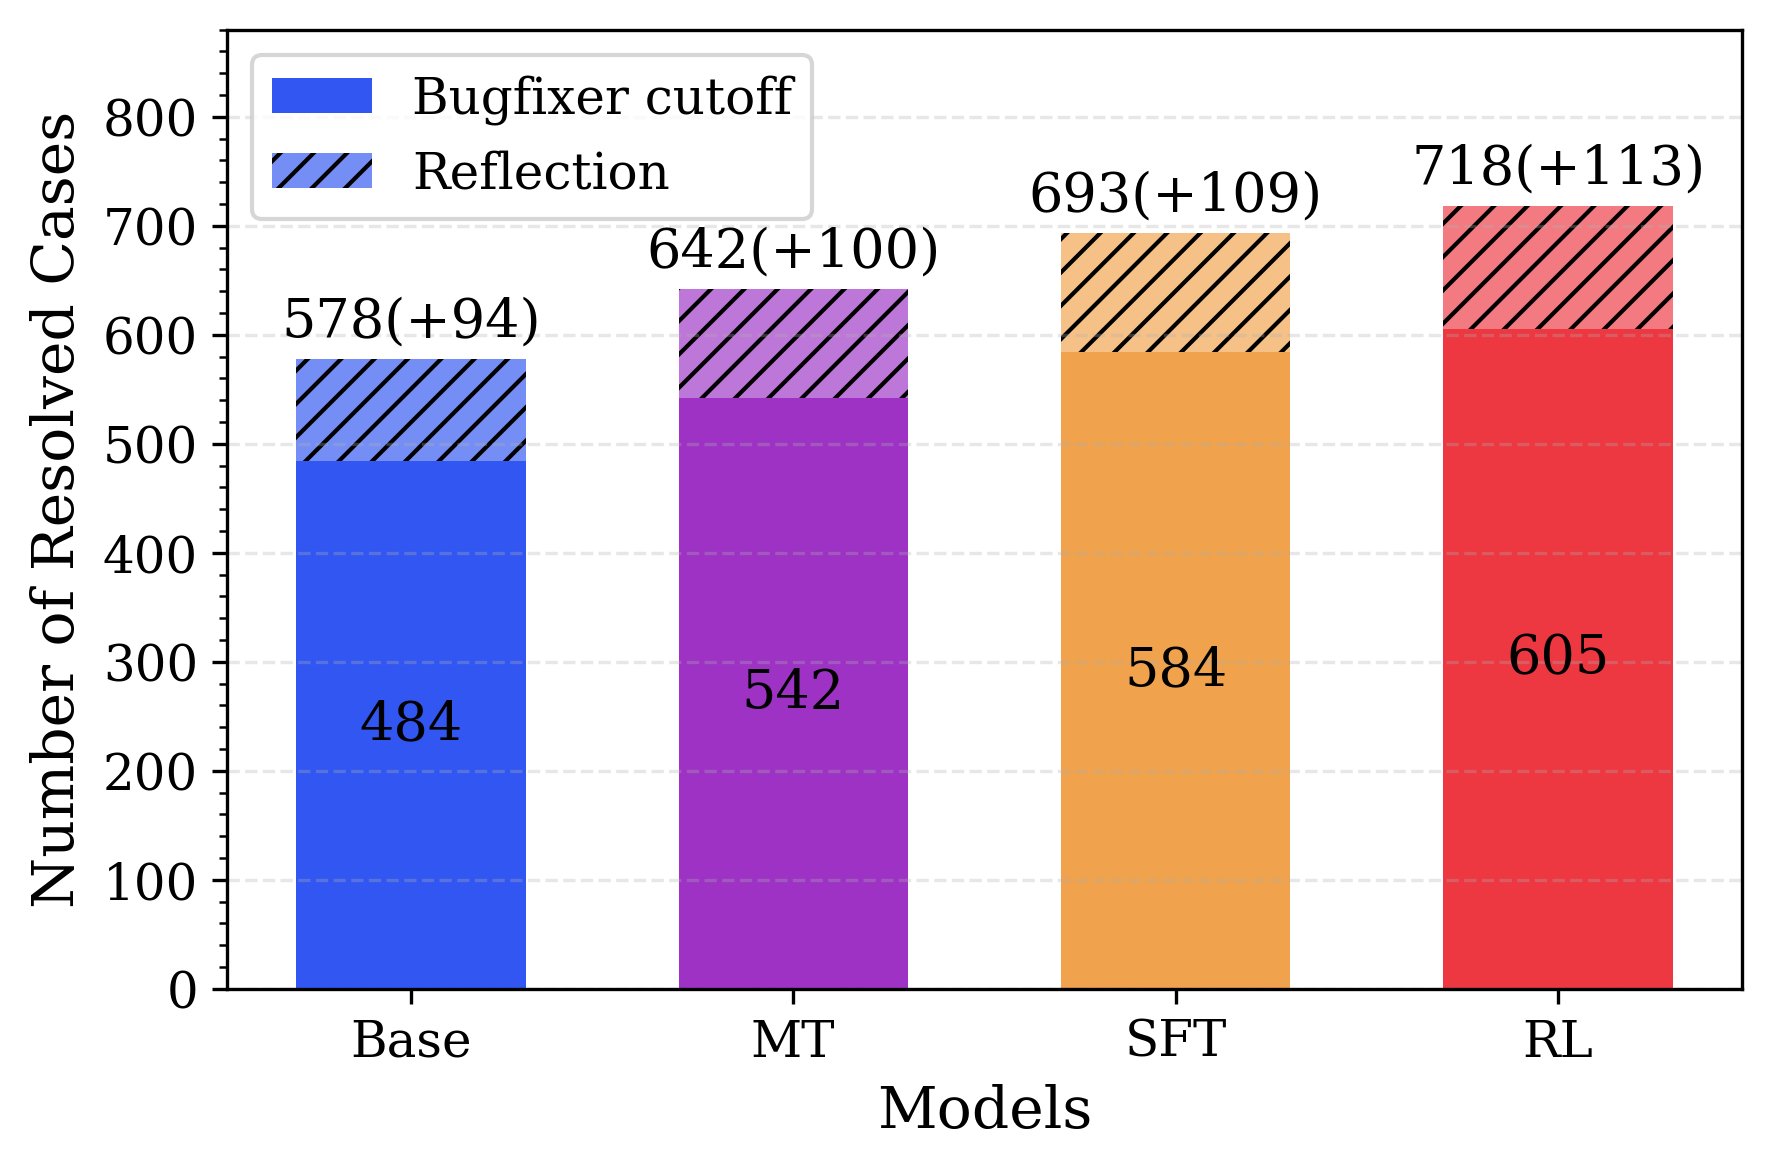
The image is a bar chart comparing the number of resolved cases for different models: Base, MT, SFT, and RL. Each model has two stacked bars representing "Bugfixer cutoff" and "Reflection". The y-axis represents the "Number of Resolved Cases," and the x-axis represents the "Models."
### Components/Axes
* **Y-axis:** "Number of Resolved Cases," ranging from 0 to 800, with gridlines at intervals of 100.
* **X-axis:** "Models," with four categories: Base, MT, SFT, and RL.
* **Legend (Top-Left):**
* Blue: "Bugfixer cutoff"
* Blue with diagonal lines: "Reflection"
### Detailed Analysis
The chart presents the number of resolved cases for each model, split into "Bugfixer cutoff" and "Reflection" components.
* **Base:**
* Bugfixer cutoff: 484
* Reflection: 94
* Total: 578 (+94)
* **MT:**
* Bugfixer cutoff: 542
* Reflection: 100
* Total: 642 (+100)
* **SFT:**
* Bugfixer cutoff: 584
* Reflection: 109
* Total: 693 (+109)
* **RL:**
* Bugfixer cutoff: 605
* Reflection: 113
* Total: 718 (+113)
### Key Observations
* The "Bugfixer cutoff" component consistently forms the larger portion of the resolved cases for each model.
* The "Reflection" component is smaller but shows a slight increase from Base to RL.
* The total number of resolved cases increases from Base to RL.
### Interpretation
The chart demonstrates the effectiveness of different models in resolving cases, broken down by "Bugfixer cutoff" and "Reflection" components. The RL model resolves the highest number of cases, followed by SFT, MT, and Base. The "Reflection" component contributes a smaller but noticeable portion to the total resolved cases, and its contribution increases slightly across the models. This suggests that the RL model is the most effective in resolving cases overall, and the "Reflection" component plays a role in improving the performance of each model.