## Stacked Bar Chart: Model Performance in Resolving Cases
### Overview
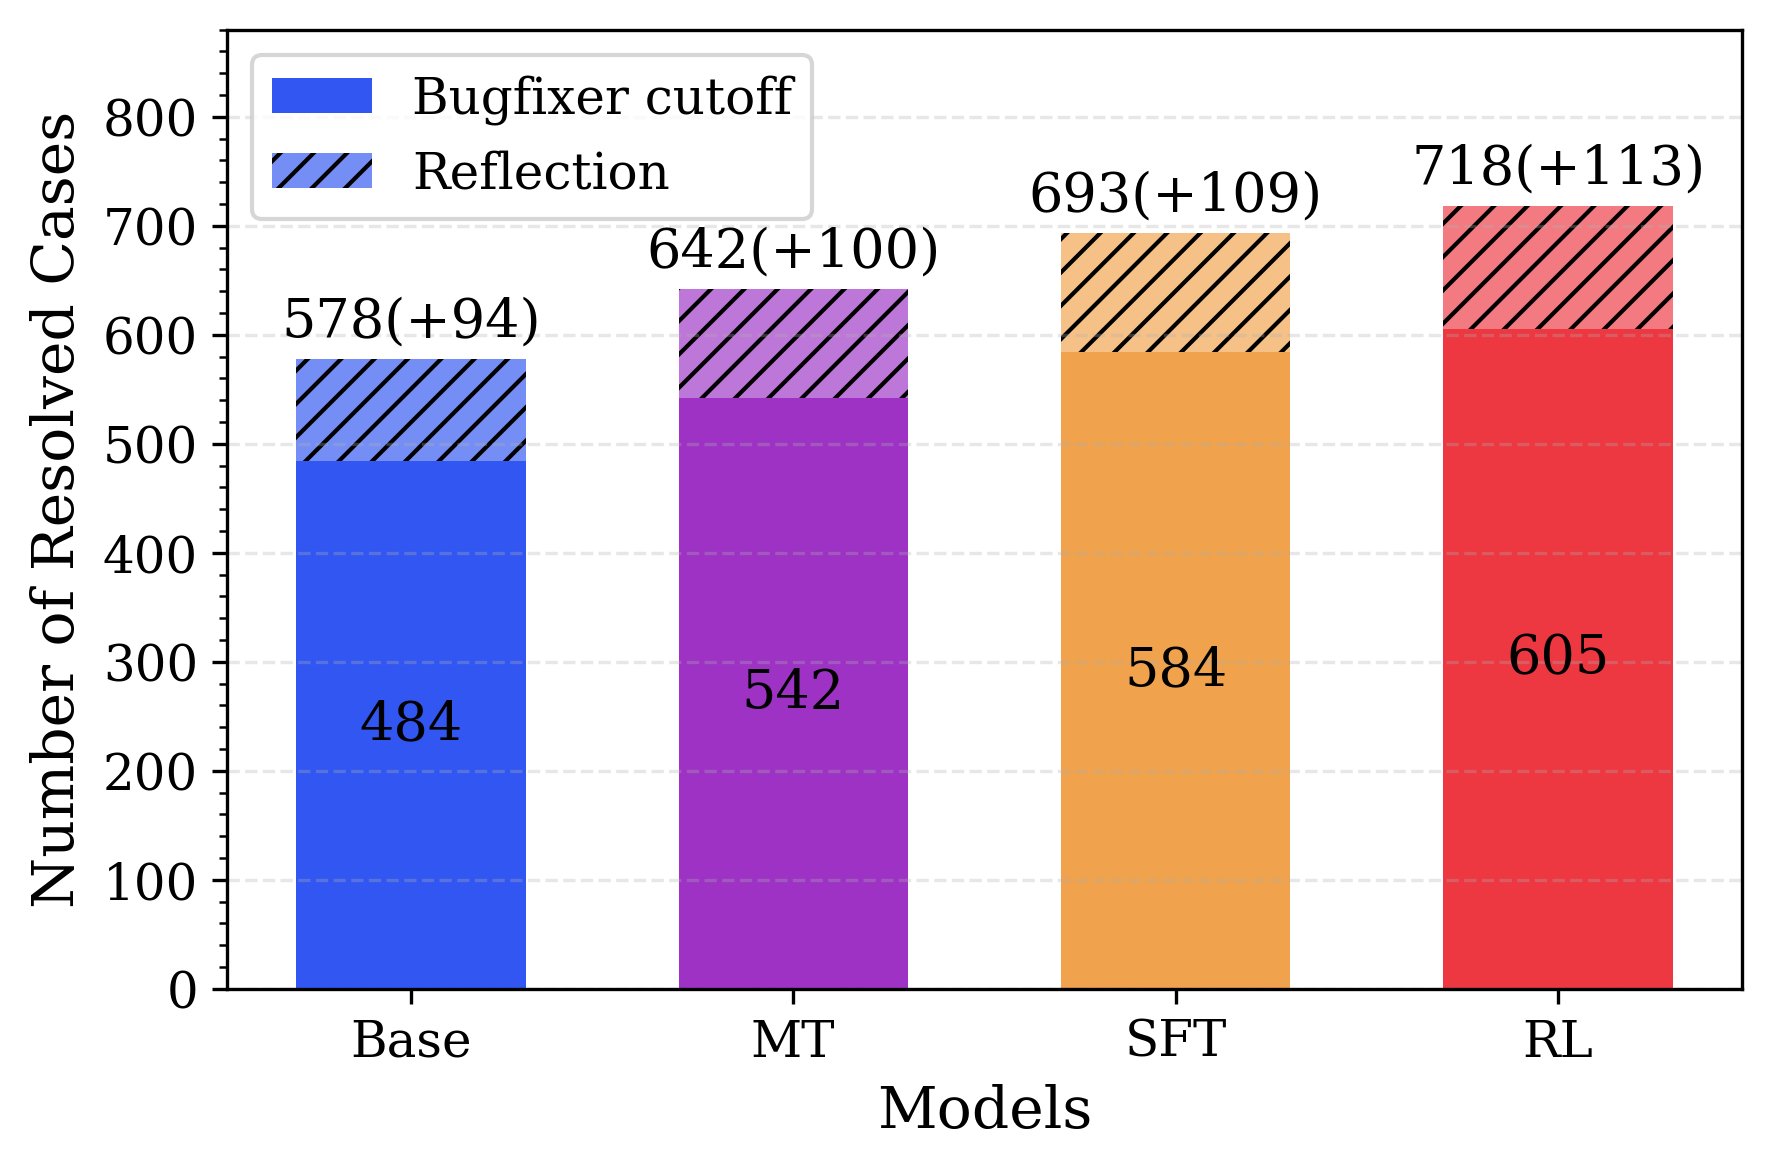
The image displays a stacked bar chart comparing the performance of four different models (Base, MT, SFT, RL) in terms of the "Number of Resolved Cases." Each bar is divided into two segments: a solid-colored base representing the "Bugfixer cutoff" and a hatched top section representing "Reflection." The chart demonstrates a clear upward trend in total resolved cases across the models, with each subsequent model showing improvement.
### Components/Axes
* **Chart Type:** Stacked Bar Chart.
* **Y-Axis:**
* **Label:** "Number of Resolved Cases"
* **Scale:** Linear, ranging from 0 to 800, with major tick marks every 100 units.
* **X-Axis:**
* **Label:** "Models"
* **Categories (from left to right):** "Base", "MT", "SFT", "RL".
* **Legend:**
* **Position:** Top-left corner of the chart area.
* **Item 1:** A solid blue rectangle labeled "Bugfixer cutoff".
* **Item 2:** A blue rectangle with diagonal hatching labeled "Reflection".
* **Data Series & Colors:**
* **Base Model:** Solid blue base, blue hatched top.
* **MT Model:** Solid purple base, purple hatched top.
* **SFT Model:** Solid orange base, orange hatched top.
* **RL Model:** Solid red base, red hatched top.
### Detailed Analysis
The chart presents the following data for each model, broken down by component:
1. **Base Model:**
* **Bugfixer cutoff (Solid Blue):** 484 cases.
* **Reflection (Hatched Blue):** 94 cases.
* **Total Resolved Cases:** 578 (annotated as "578(+94)").
2. **MT Model:**
* **Bugfixer cutoff (Solid Purple):** 542 cases.
* **Reflection (Hatched Purple):** 100 cases.
* **Total Resolved Cases:** 642 (annotated as "642(+100)").
3. **SFT Model:**
* **Bugfixer cutoff (Solid Orange):** 584 cases.
* **Reflection (Hatched Orange):** 109 cases.
* **Total Resolved Cases:** 693 (annotated as "693(+109)").
4. **RL Model:**
* **Bugfixer cutoff (Solid Red):** 605 cases.
* **Reflection (Hatched Red):** 113 cases.
* **Total Resolved Cases:** 718 (annotated as "718(+113)").
**Trend Verification:**
* The **"Bugfixer cutoff"** component shows a steady upward trend: 484 → 542 → 584 → 605.
* The **"Reflection"** component also shows a steady upward trend: 94 → 100 → 109 → 113.
* The **Total Resolved Cases** consequently show a consistent upward trend: 578 → 642 → 693 → 718.
### Key Observations
* **Consistent Improvement:** Each model (Base → MT → SFT → RL) outperforms the previous one in both the "Bugfixer cutoff" and "Reflection" components, leading to a higher total.
* **Dominant Component:** The "Bugfixer cutoff" constitutes the majority of resolved cases for all models, ranging from approximately 83.7% (Base) to 84.3% (RL) of the total.
* **Growth of "Reflection":** The contribution from "Reflection" increases in absolute terms (from 94 to 113) and as a percentage of the total (from ~16.3% to ~15.7% - note: while the absolute number grows, its percentage share slightly decreases as the base grows faster).
* **Largest Gains:** The most significant total improvement occurs between the "Base" and "MT" models (+64 cases). The incremental gain from "SFT" to "RL" is the smallest (+25 cases), suggesting potential diminishing returns.
### Interpretation
This chart likely illustrates the results of an iterative model development or training process in a technical domain, such as automated bug fixing or problem resolution. The "Bugfixer cutoff" may represent a baseline or initial resolution capability, while "Reflection" could signify an additional, perhaps more sophisticated, reasoning or self-correction step that yields further resolutions.
The data suggests that sequential training or refinement techniques (represented by MT, SFT, RL) are effective. The "RL" (likely Reinforcement Learning) model achieves the highest performance, indicating that this training paradigm is the most successful among those tested for this task. The consistent, additive contribution of the "Reflection" component across all models implies it is a valuable and complementary module to the core "Bugfixer" system. The narrowing gap between later models (SFT to RL) might indicate that the problem space is approaching a performance ceiling with the current methodology, or that further gains require more substantial architectural changes.