## Map: Rajasthan Rain Gauge Locations
### Overview
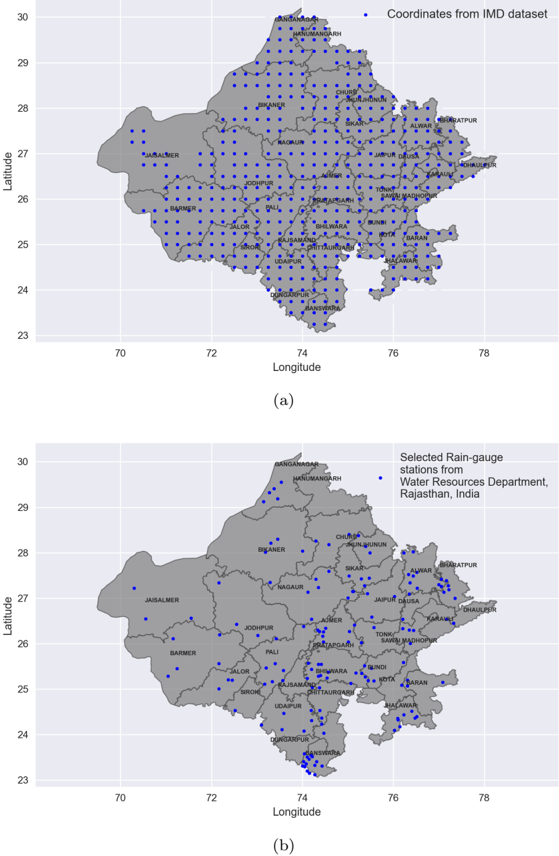
The image presents two maps of Rajasthan, India, showing the locations of rain gauges. Map (a) displays coordinates from the IMD (India Meteorological Department) dataset, while map (b) shows selected rain-gauge stations from the Water Resources Department, Rajasthan. Both maps depict the state's outline, major cities, and the distribution of rain gauge locations as blue dots.
### Components/Axes
* **Map Outline:** The grey outline represents the state of Rajasthan, India.
* **Latitude Axis (Y-axis):** Ranges from approximately 23 to 30.
* **Longitude Axis (X-axis):** Ranges from approximately 70 to 78.
* **City Labels:** Names of cities are overlaid on the map.
* **Blue Dots:** Represent rain gauge locations.
* **Legends:**
* **(a):** "Coordinates from IMD dataset" (top-right)
* **(b):** "Selected Rain-gauge stations from Water Resources Department, Rajasthan, India" (top-right)
### Detailed Analysis
**Map (a): Coordinates from IMD dataset**
* The blue dots are distributed relatively evenly across the state, forming a grid-like pattern.
* The density of points appears higher in the eastern part of the state.
* The coordinates are spaced approximately 0.25 degrees apart in both latitude and longitude.
**Map (b): Selected Rain-gauge stations from Water Resources Department, Rajasthan, India**
* The blue dots are distributed unevenly, with clusters in certain regions and sparse coverage in others.
* There is a higher concentration of rain gauges in the southeastern and eastern parts of the state.
* The western part of the state has fewer rain gauges.
* The rain gauges appear to be located near cities and towns.
**City Locations (Both Maps):**
* Major cities labeled include: Ganganagar, Hanumangarh, Churu, Jhunjhunun, Bikaner, Sikar, Nagaur, Alwar, Bharatpur, Jaisalmer, Jaipur, Dausa, Dhaulpur, Jodhpur, Ajmer, Karauli, Barmer, Pali, Tonk, Sawai Madhopur, Bundi, Jalore, Sirohi, Bhilwara, Kota, Baran, Jhalawar, Udaipur, Chittaurgarh, Dungarpur, Banswara.
### Key Observations
* Map (a) provides a systematic grid of coordinates, likely for comprehensive data collection.
* Map (b) shows the actual locations of rain gauges managed by the Water Resources Department, which are not uniformly distributed.
* The eastern and southeastern regions of Rajasthan have a higher density of rain gauges in map (b) compared to the western region.
### Interpretation
The two maps provide different perspectives on rain gauge locations in Rajasthan. Map (a) represents a theoretical or planned distribution of data collection points, while map (b) shows the actual distribution of operational rain gauges. The difference in distribution suggests that the Water Resources Department may prioritize certain regions for monitoring, possibly due to higher rainfall, agricultural importance, or water resource management needs. The IMD dataset likely serves a broader purpose of weather monitoring and forecasting, hence the systematic grid. The clustering of rain gauges in the southeastern part of the state could indicate a region with higher rainfall variability or greater water resource demands.