## Map: Rainfall Station Distribution in Rajasthan, India
### Overview
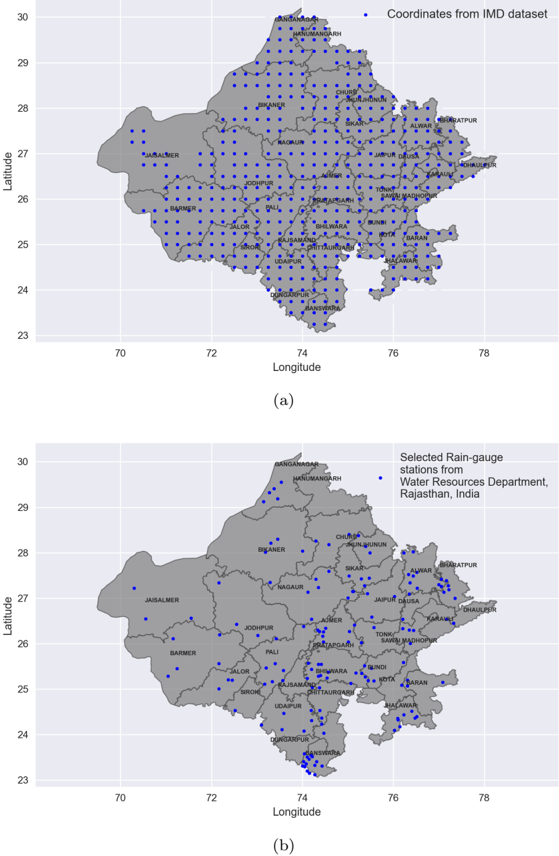
The image presents two maps of the state of Rajasthan, India. Both maps display the geographical boundaries of the state overlaid with numerous blue dots representing rainfall stations. The top map (a) shows the distribution of coordinates sourced from the IMD (India Meteorological Department) dataset. The bottom map (b) displays selected rain-gauge stations from the Water Resources Department, Rajasthan, India. Both maps share the same latitude and longitude axes.
### Components/Axes
* **X-axis:** Longitude, ranging from approximately 70 to 78.
* **Y-axis:** Latitude, ranging from approximately 23 to 30.
* **Map Boundary:** The grey shaded area represents the geographical boundaries of Rajasthan, India.
* **Dots:** Blue dots represent rainfall stations.
* **Labels:** Several cities and towns within Rajasthan are labeled on both maps.
* **Titles:**
* (a): "Coordinates from IMD dataset"
* (b): "Selected Rain-gauge stations from Water Resources Department, Rajasthan, India"
### Detailed Analysis or Content Details
**Map (a): Coordinates from IMD dataset**
The map displays a dense distribution of rainfall stations across Rajasthan. The stations are not uniformly distributed; there appears to be a higher concentration in the eastern and southeastern regions of the state.
* **Northernmost Station:** Approximately 29.3 Latitude, 71.5 Longitude (near Hanumangarh).
* **Southernmost Station:** Approximately 23.8 Latitude, 74.5 Longitude (near Udaipur).
* **Westernmost Station:** Approximately 26.5 Latitude, 70.0 Longitude (near Jaisalmer).
* **Easternmost Station:** Approximately 27.5 Latitude, 77.5 Longitude (near Sriganganagar).
* **Labeled Cities (approximate coordinates):**
* Jaisalmer: 26.9 Latitude, 70.9 Longitude
* Jodhpur: 26.3 Latitude, 73.0 Longitude
* Udaipur: 24.6 Latitude, 73.7 Longitude
* Jaipur: 26.9 Latitude, 75.8 Longitude
* Bikaner: 27.9 Latitude, 73.3 Longitude
* Ajmer: 26.5 Latitude, 74.6 Longitude
* Kota: 24.8 Latitude, 76.3 Longitude
* Sriganganagar: 29.3 Latitude, 73.8 Longitude
* Hanumangarh: 29.3 Latitude, 72.6 Longitude
**Map (b): Selected Rain-gauge stations from Water Resources Department, Rajasthan, India**
This map shows a sparser distribution of rainfall stations compared to map (a). The stations are still concentrated in the eastern and southeastern regions, but with fewer stations overall.
* **Northernmost Station:** Approximately 29.3 Latitude, 72.5 Longitude (near Hanumangarh).
* **Southernmost Station:** Approximately 24.0 Latitude, 74.5 Longitude (near Udaipur).
* **Westernmost Station:** Approximately 26.5 Latitude, 70.5 Longitude (near Jaisalmer).
* **Easternmost Station:** Approximately 27.5 Latitude, 77.0 Longitude (near Sriganganagar).
* **Labeled Cities (approximate coordinates):**
* Jaisalmer: 26.9 Latitude, 70.9 Longitude
* Jodhpur: 26.3 Latitude, 73.0 Longitude
* Udaipur: 24.6 Latitude, 73.7 Longitude
* Jaipur: 26.9 Latitude, 75.8 Longitude
* Bikaner: 27.9 Latitude, 73.3 Longitude
* Ajmer: 26.5 Latitude, 74.6 Longitude
* Kota: 24.8 Latitude, 76.3 Longitude
* Sriganganagar: 29.3 Latitude, 73.8 Longitude
* Hanumangarh: 29.3 Latitude, 72.6 Longitude
### Key Observations
* The IMD dataset (map a) contains significantly more rainfall station data points than the Water Resources Department dataset (map b).
* Both datasets show a higher density of stations in the eastern and southeastern parts of Rajasthan.
* The spatial distribution of stations is similar between the two datasets, suggesting that the Water Resources Department stations are likely a subset of the IMD dataset.
* The western part of Rajasthan, particularly the desert region, has a relatively sparse distribution of rainfall stations in both datasets.
### Interpretation
The maps demonstrate the distribution of rainfall monitoring stations in Rajasthan, India, sourced from two different organizations. The difference in the number of stations between the IMD and Water Resources Department datasets suggests varying levels of monitoring coverage and data collection efforts. The concentration of stations in the eastern and southeastern regions likely reflects higher rainfall amounts and agricultural activity in those areas, necessitating more detailed monitoring. The sparse distribution in the western desert region is consistent with the arid climate and lower population density.
The comparison of these maps is valuable for understanding the spatial coverage of rainfall data in Rajasthan. It highlights the potential for data integration and collaboration between different agencies to improve the accuracy and reliability of rainfall monitoring and water resource management. The maps also reveal potential gaps in monitoring coverage, particularly in the western region, which could be addressed through the installation of additional rainfall stations. The maps are descriptive and do not provide any quantitative data about rainfall amounts or trends. They are purely spatial representations of station locations.