\n
## Geographic Scatter Plot: Rain-Gauge Station Locations in Rajasthan, India
### Overview
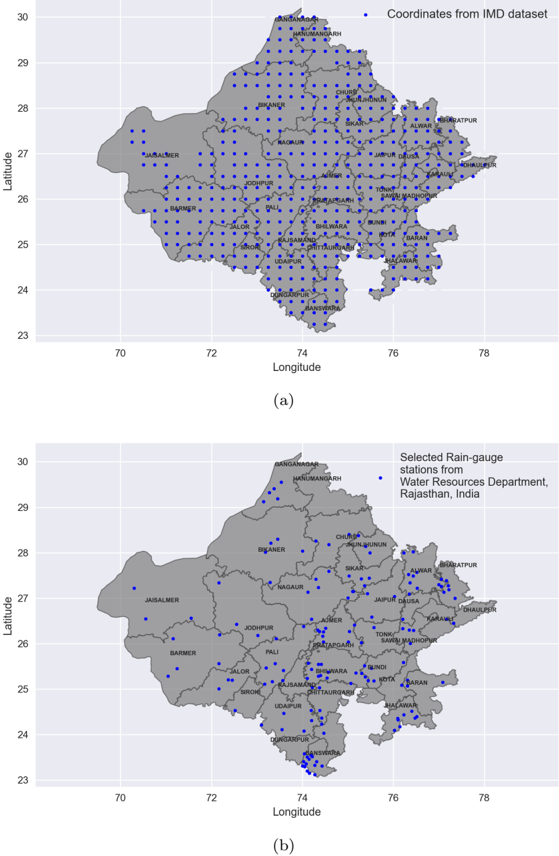
The image contains two vertically stacked scatter plots, labeled (a) and (b), displaying the geographic distribution of rain-gauge stations across the state of Rajasthan, India. Both plots use the same base map outline and coordinate system. Plot (a) shows a very dense network of stations from one dataset, while plot (b) shows a much sparser, selected subset from another source.
### Components/Axes
* **Plot Type:** Geographic scatter plot (map with point data).
* **Axes (Both Plots):**
* **X-axis:** "Longitude". Scale ranges from approximately 69 to 79 degrees East. Major tick marks are at 70, 72, 74, 76, and 78.
* **Y-axis:** "Latitude". Scale ranges from approximately 22.5 to 30.5 degrees North. Major tick marks are at 23, 24, 25, 26, 27, 28, 29, and 30.
* **Base Map:** A grey-filled polygon representing the administrative boundary of Rajasthan, India. Internal district boundaries are faintly visible.
* **Data Points:** Small blue dots representing station locations.
* **Legends:**
* **Plot (a) - Top Right:** "Coordinates from IMD dataset" (IMD likely refers to India Meteorological Department).
* **Plot (b) - Top Right:** "Selected Rain-gauge stations from Water Resources Department, Rajasthan, India".
* **Labels:** Numerous city and town names are printed in black text adjacent to their approximate locations on the map.
### Detailed Analysis
**Plot (a): IMD Dataset Coordinates**
* **Spatial Distribution:** The blue dots are extremely dense, forming an almost continuous grid-like pattern across the entire state. Coverage appears comprehensive, with stations in nearly every district.
* **Density:** Highest density appears in the central and eastern regions. The western desert region (around Jaisalmer, Barmer) has a slightly lower but still substantial density.
* **Labeled Locations (Partial List, from North to South, West to East):** Sri Ganganagar, Hanumangarh, Bikaner, Jaisalmer, Barmer, Jodhpur, Nagaur, Churu, Jhunjhunu, Sikar, Alwar, Jaipur, Dausa, Kota, Bundi, Baran, Jhalawar, Pratapgarh, Udaipur, Dungarpur, Banswara, Chittorgarh, Rajsamand, Bhilwara, Ajmer, Tonk, Sawai Madhopur, Karauli, Bharatpur, Dholpur, Sirohi, Pali, Jalor.
**Plot (b): Selected Water Resources Department Stations**
* **Spatial Distribution:** The blue dots are sparse and unevenly distributed. There are large areas with no stations, particularly in the western and northern parts of the state.
* **Density:** The highest concentration of selected stations is in the southeastern region, around the districts of Kota, Bundi, Baran, and Jhalawar. Another cluster exists in the south around Udaipur and Dungarpur. The vast western desert and the northern plains have very few selected stations.
* **Labeled Locations (Partial List, corresponding to visible dots):** Hanumangarh, Bikaner, Churu, Jhunjhunu, Sikar, Alwar, Jaipur, Dausa, Sawai Madhopur, Karauli, Bharatpur, Dholpur, Kota, Bundi, Baran, Jhalawar, Pratapgarh, Udaipur, Dungarpur, Banswara, Chittorgarh, Rajsamand, Bhilwara, Ajmer, Tonk, Pali, Jodhpur, Jaisalmer, Barmer.
### Key Observations
1. **Drastic Reduction in Stations:** Plot (b) represents a significant subset of the stations shown in plot (a). The selection is not uniform and appears to prioritize certain river basins or administrative zones over others.
2. **Geographic Bias in Selection:** The selected network in (b) is heavily biased towards the eastern and southeastern parts of Rajasthan, which are relatively more humid and have major river systems (like the Chambal and Banas). The arid western region is severely undersampled in the selected network.
3. **Consistency in Labeling:** The city labels are consistent between the two plots, serving as geographic reference points. The dots in (b) align with the locations of some, but not all, of the labels present in (a).
### Interpretation
These maps visually demonstrate the difference between a comprehensive meteorological observation network (IMD) and a purposefully selected hydrological monitoring network (Water Resources Department).
* **Purpose & Scope:** The IMD dataset (a) is designed for broad-scale weather and climate monitoring, requiring dense spatial coverage to capture regional patterns. The Water Resources Department network (b) is likely designed for specific purposes like river flow forecasting, groundwater monitoring, or irrigation management, leading to a focus on areas with significant water resources or human activity.
* **Data Implications:** Any analysis using only the selected stations from (b) would have a significant spatial bias. It would poorly represent rainfall variability in western Rajasthan, potentially leading to inaccurate water resource assessments or drought monitoring for that region. The IMD dataset (a) provides a more reliable foundation for statewide climatic analysis.
* **Underlying Message:** The figure likely argues for the importance of using dense, spatially representative datasets (like IMD's) for accurate hydrological or agricultural modeling in Rajasthan, as relying on sparser, purpose-selected networks can introduce substantial geographic gaps and bias. The Peircean insight here is that the *absence* of data points in the west of plot (b) is as informative as their presence in the east—it signifies a monitoring priority or a resource limitation.