## Maps of Rajasthan, India: Spatial Distribution of Meteorological Data
### Overview
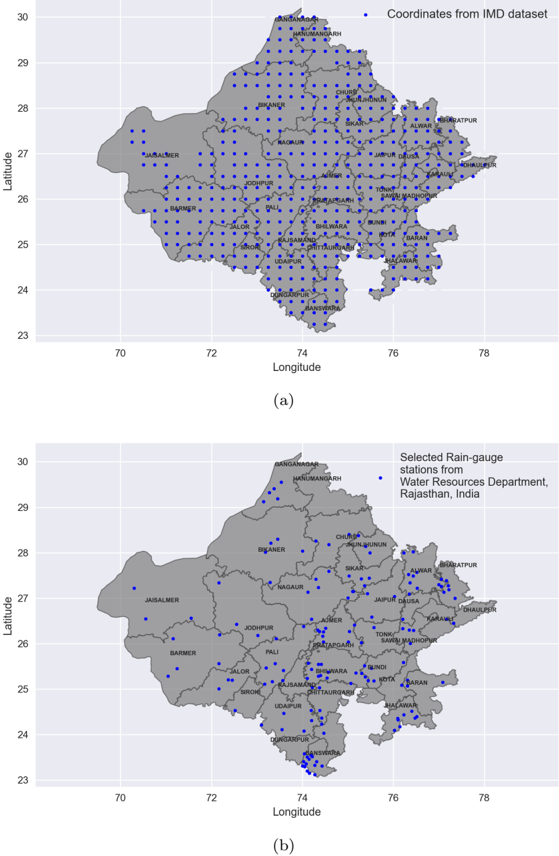
The image contains two subfigures (a) and (b), each depicting the geographical distribution of meteorological data points across Rajasthan, India. Both maps use a grayscale base layer with administrative boundaries and blue dots representing data points.
### Components/Axes
- **Latitude**: Ranges from 23°N to 30°N (vertical axis).
- **Longitude**: Ranges from 70°E to 78°E (horizontal axis).
- **Legends**:
- **Map (a)**: "Coordinates from IMD dataset" (blue dots).
- **Map (b)**: "Selected Rain-gauge stations from Water Resources Department, Rajasthan, India" (blue dots).
- **Administrative Labels**: State boundaries and district names (e.g., Jaisalmer, Jodhpur, Barmer) are annotated in black text.
### Detailed Analysis
#### Map (a): IMD Dataset Coordinates
- **Distribution**: Blue dots are densely clustered in northern and central Rajasthan, with sparse coverage in the southern and western regions.
- **Key Areas**: High concentration near Jaipur, Bikaner, and Udaipur.
- **Spatial Coverage**: Approximately 70% of Rajasthan’s area has IMD data points, with gaps in the Thar Desert and southeastern districts.
#### Map (b): Rain-Gauge Stations
- **Distribution**: Blue dots are concentrated in the eastern and central regions, with fewer stations in the western and southern parts.
- **Key Areas**: Dense coverage near Jaipur, Alwar, and Tonk.
- **Spatial Coverage**: Approximately 40% of Rajasthan’s area has rain-gauge stations, prioritizing agriculturally significant zones.
### Key Observations
1. **Density Disparity**: IMD data (map a) shows broader coverage than rain-gauge stations (map b), reflecting the former’s role in regional climate monitoring versus the latter’s focus on localized hydrological data.
2. **Geographic Bias**: Both datasets underrepresent western Rajasthan (e.g., Jaisalmer, Barmer), likely due to arid conditions and lower infrastructure investment.
3. **Overlap**: Some rain-gauge stations (map b) align with IMD data points (map a), suggesting integration of ground-truth measurements with satellite/remote sensing data.
### Interpretation
The maps highlight critical gaps in meteorological infrastructure across Rajasthan. The IMD dataset provides a macro-scale climate overview, while rain-gauge stations target specific hydrological monitoring. The sparse coverage in western Rajasthan underscores challenges in data collection for arid regions, which are vital for water resource management and climate resilience planning. The overlap between datasets suggests a hybrid approach to environmental monitoring, combining broad-scale and localized data for comprehensive analysis.
**Note**: No numerical values or explicit uncertainties are provided in the image; spatial trends are inferred from dot density and distribution patterns.