## Diagram: Causal Network
### Overview
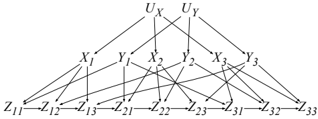
The image presents a causal network diagram illustrating relationships between variables denoted as U, X, Y, and Z. The diagram shows directed edges (arrows) indicating the direction of influence between these variables. The network is structured in three layers, with U at the top, X and Y in the middle, and Z at the bottom.
### Components/Axes
* **Nodes:** The nodes in the diagram represent variables.
* Top Layer: U<sub>X</sub>, U<sub>Y</sub>
* Middle Layer: X<sub>1</sub>, Y<sub>1</sub>, X<sub>2</sub>, Y<sub>2</sub>, X<sub>3</sub>, Y<sub>3</sub>
* Bottom Layer: Z<sub>11</sub>, Z<sub>12</sub>, Z<sub>13</sub>, Z<sub>21</sub>, Z<sub>22</sub>, Z<sub>23</sub>, Z<sub>31</sub>, Z<sub>32</sub>, Z<sub>33</sub>
* **Edges:** The edges (arrows) represent causal relationships. The direction of the arrow indicates the direction of influence.
### Detailed Analysis
The diagram can be analyzed layer by layer:
* **Top Layer (U):**
* U<sub>X</sub> influences X<sub>1</sub>, X<sub>2</sub>, and X<sub>3</sub>.
* U<sub>Y</sub> influences Y<sub>1</sub>, Y<sub>2</sub>, and Y<sub>3</sub>.
* **Middle Layer (X, Y):**
* X<sub>1</sub> influences Z<sub>11</sub>, Z<sub>12</sub>, Z<sub>13</sub>, Z<sub>21</sub>, Z<sub>22</sub>, Z<sub>23</sub>, Z<sub>31</sub>, Z<sub>32</sub>, Z<sub>33</sub>.
* Y<sub>1</sub> influences Z<sub>11</sub>, Z<sub>12</sub>, Z<sub>13</sub>, Z<sub>21</sub>, Z<sub>22</sub>, Z<sub>23</sub>, Z<sub>31</sub>, Z<sub>32</sub>, Z<sub>33</sub>.
* X<sub>2</sub> influences Z<sub>11</sub>, Z<sub>12</sub>, Z<sub>13</sub>, Z<sub>21</sub>, Z<sub>22</sub>, Z<sub>23</sub>, Z<sub>31</sub>, Z<sub>32</sub>, Z<sub>33</sub>.
* Y<sub>2</sub> influences Z<sub>11</sub>, Z<sub>12</sub>, Z<sub>13</sub>, Z<sub>21</sub>, Z<sub>22</sub>, Z<sub>23</sub>, Z<sub>31</sub>, Z<sub>32</sub>, Z<sub>33</sub>.
* X<sub>3</sub> influences Z<sub>11</sub>, Z<sub>12</sub>, Z<sub>13</sub>, Z<sub>21</sub>, Z<sub>22</sub>, Z<sub>23</sub>, Z<sub>31</sub>, Z<sub>32</sub>, Z<sub>33</sub>.
* Y<sub>3</sub> influences Z<sub>11</sub>, Z<sub>12</sub>, Z<sub>13</sub>, Z<sub>21</sub>, Z<sub>22</sub>, Z<sub>23</sub>, Z<sub>31</sub>, Z<sub>32</sub>, Z<sub>33</sub>.
* **Bottom Layer (Z):**
* Z<sub>11</sub> influences Z<sub>12</sub>.
* Z<sub>12</sub> influences Z<sub>13</sub>.
* Z<sub>21</sub> influences Z<sub>22</sub>.
* Z<sub>22</sub> influences Z<sub>23</sub>.
* Z<sub>31</sub> influences Z<sub>32</sub>.
* Z<sub>32</sub> influences Z<sub>33</sub>.
### Key Observations
* U<sub>X</sub> and U<sub>Y</sub> are the root causes influencing the X and Y variables, respectively.
* Each X and Y variable influences all Z variables.
* The Z variables are sequentially linked within each group (1, 2, 3).
### Interpretation
The diagram represents a complex causal model where U<sub>X</sub> and U<sub>Y</sub> are upstream variables that influence X and Y variables. These X and Y variables, in turn, have a direct influence on all Z variables. Additionally, there is a sequential dependency among the Z variables within each group (1, 2, 3). This type of diagram is used to visualize and understand the relationships between different variables in a system, which can be useful for making predictions or interventions.