\n
## Diagram: Factor Graph
### Overview
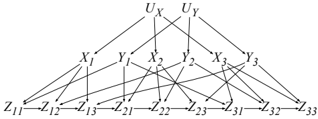
The image depicts a factor graph, a bipartite graph used to represent the factorization of a function. The graph consists of variable nodes and factor nodes, connected by edges. This particular graph appears to represent a system with three variables (X and Y indexed by 1, 2, and 3) and several intermediate and output variables (Z indexed by two numbers).
### Components/Axes
The diagram consists of the following nodes:
* **Variable Nodes:** X<sub>1</sub>, Y<sub>1</sub>, X<sub>2</sub>, Y<sub>2</sub>, X<sub>3</sub>, Y<sub>3</sub>, Z<sub>11</sub>, Z<sub>12</sub>, Z<sub>13</sub>, Z<sub>21</sub>, Z<sub>22</sub>, Z<sub>23</sub>, Z<sub>31</sub>, Z<sub>32</sub>, Z<sub>33</sub>, U<sub>x</sub>, U<sub>y</sub>
* **Factor Nodes:** Implicitly represented by the connections between variable nodes.
The graph is structured in three layers:
1. Top Layer: U<sub>x</sub>, U<sub>y</sub>
2. Middle Layer: X<sub>1</sub>, Y<sub>1</sub>, X<sub>2</sub>, Y<sub>2</sub>, X<sub>3</sub>, Y<sub>3</sub>
3. Bottom Layer: Z<sub>11</sub>, Z<sub>12</sub>, Z<sub>13</sub>, Z<sub>21</sub>, Z<sub>22</sub>, Z<sub>23</sub>, Z<sub>31</sub>, Z<sub>32</sub>, Z<sub>33</sub>
Edges connect nodes between adjacent layers.
### Detailed Analysis / Content Details
The connections (factors) are as follows:
* U<sub>x</sub> is connected to X<sub>1</sub>, X<sub>2</sub>, X<sub>3</sub>.
* U<sub>y</sub> is connected to Y<sub>1</sub>, Y<sub>2</sub>, Y<sub>3</sub>.
* X<sub>1</sub> is connected to Z<sub>11</sub>, Z<sub>12</sub>, Z<sub>13</sub>.
* Y<sub>1</sub> is connected to Z<sub>11</sub>, Z<sub>21</sub>, Z<sub>31</sub>.
* X<sub>2</sub> is connected to Z<sub>12</sub>, Z<sub>22</sub>, Z<sub>32</sub>.
* Y<sub>2</sub> is connected to Z<sub>21</sub>, Z<sub>22</sub>, Z<sub>23</sub>.
* X<sub>3</sub> is connected to Z<sub>13</sub>, Z<sub>23</sub>, Z<sub>33</sub>.
* Y<sub>3</sub> is connected to Z<sub>31</sub>, Z<sub>32</sub>, Z<sub>33</sub>.
The graph is fully connected between layers, indicating that each factor depends on all variables in the adjacent layers.
### Key Observations
The structure suggests a system where U<sub>x</sub> and U<sub>y</sub> represent some input or prior information that influences the variables X and Y, respectively. The Z variables represent the combined effect of X and Y. The indexing of the Z variables (e.g., Z<sub>ij</sub>) suggests a relationship between the i-th X variable and the j-th Y variable.
### Interpretation
This factor graph likely represents a probabilistic model where the joint probability distribution can be factored into a product of functions (factors) involving pairs of variables. The U variables could represent prior distributions or constraints on the X and Y variables. The Z variables could represent observations or measurements that depend on the values of X and Y.
The graph's structure suggests that the variables X and Y are conditionally independent given the Z variables. The connections between U<sub>x</sub> and X<sub>i</sub>, and U<sub>y</sub> and Y<sub>i</sub>, indicate that the U variables influence the distributions of the X and Y variables.
The specific meaning of the variables and factors would depend on the context of the application. However, the factor graph provides a clear and concise representation of the relationships between the variables and factors in the model. This is a common representation in areas like Bayesian networks, Markov random fields, and graphical models.