## Diagram: Hierarchical Network Diagram
### Overview
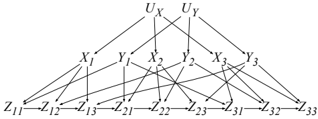
The image displays a monochrome, three-layer hierarchical network diagram composed of nodes (represented by text labels) and connecting lines (edges). The structure suggests a system of variables or components organized into distinct levels, with dense interconnections between layers. There are no numerical data, charts, or axes; the information is purely structural and relational.
### Components/Axes
The diagram has no traditional axes or legends. All elements are textual labels and connecting lines.
**Node Labels & Spatial Positioning:**
* **Top Layer (Center):** Two nodes.
* `U_X` (Top-center, slightly left)
* `U_Y` (Top-center, slightly right)
* **Middle Layer (Center):** Six nodes arranged in a horizontal row.
* `X_1`, `Y_1`, `X_2`, `Y_2`, `X_3`, `Y_3` (from left to right)
* **Bottom Layer (Center):** Nine nodes arranged in a horizontal row.
* `Z_11`, `Z_12`, `Z_13`, `Z_21`, `Z_22`, `Z_23`, `Z_31`, `Z_32`, `Z_33` (from left to right)
**Language:** All text is in English, using standard Latin characters and mathematical subscript notation.
### Detailed Analysis
**Connection Topology (Edge Analysis):**
The diagram is an undirected graph. The connections form a strict, layered hierarchy:
1. **Top to Middle Layer:**
* The node `U_X` is connected by straight lines to all three `X` nodes in the middle layer: `X_1`, `X_2`, and `X_3`.
* The node `U_Y` is connected by straight lines to all three `Y` nodes in the middle layer: `Y_1`, `Y_2`, and `Y_3`.
* There are no cross-connections (e.g., `U_X` to `Y` nodes or `U_Y` to `X` nodes).
2. **Middle to Bottom Layer:**
* This layer exhibits a **fully connected bipartite graph** structure between the set of middle-layer nodes (`X_1, Y_1, X_2, Y_2, X_3, Y_3`) and the set of bottom-layer nodes (`Z_11` through `Z_33`).
* **Trend Verification:** Visually, every node in the middle layer has a line extending to every node in the bottom layer. This creates a dense, web-like pattern of overlapping lines.
* For example, tracing from `X_1`: lines connect to `Z_11`, `Z_12`, `Z_13`, `Z_21`, `Z_22`, `Z_23`, `Z_31`, `Z_32`, and `Z_33`. The same pattern holds for `Y_1`, `X_2`, etc.
### Key Observations
1. **Symmetry and Pattern:** The diagram is highly symmetrical. The `X` and `Y` sub-trees are mirror images in structure. The `Z` nodes are indexed with a double subscript (`ij`), where `i` likely corresponds to a group (1, 2, or 3) and `j` to a position within that group (1, 2, or 3).
2. **Connection Density:** The connection density increases dramatically from the top layer (2 nodes, 6 edges) to the middle-bottom interface (6 nodes connecting to 9 nodes, resulting in 54 edges).
3. **Absence of Directionality:** Lines have no arrowheads, indicating the relationships are undirected or that the direction of influence is not specified in this diagram.
4. **Visual Complexity:** The dense interconnection between the middle and bottom layers makes individual line tracing difficult, emphasizing the systemic complexity over individual pathways.
### Interpretation
This diagram likely represents a **probabilistic graphical model** (such as a Bayesian network or a factor graph) or a **system architecture** with hierarchical dependencies.
* **What the data suggests:** The structure implies a generative or causal flow from top to bottom. The `U` nodes (`U_X`, `U_Y`) could represent **latent variables** or **global parameters** that influence distinct families of intermediate variables (`X` and `Y` series). These intermediate variables, in turn, jointly influence or generate the entire set of observed variables or outcomes (`Z` series).
* **How elements relate:** The strict separation between the `X` and `Y` branches at the top suggests two independent or semi-independent processes (`U_X` -> `X_i` and `U_Y` -> `Y_i`). However, their complete mixing at the bottom layer indicates that all final outcomes (`Z_jk`) are influenced by *both* processes. This is a classic structure for modeling confounding factors or integrated systems.
* **Notable Anomalies/Patterns:** The most striking feature is the **complete connectivity** between the middle and bottom layers. In a practical model, this would imply that every intermediate variable has a potential effect on every outcome, which is computationally complex but may represent a system where all components interact. The double-subscript notation for `Z` (`Z_11` to `Z_33`) strongly suggests a 3x3 matrix or a two-dimensional grouping of the bottom-layer variables.
**In summary, the image conveys a complex, hierarchical system where two high-level factors branch into separate intermediate streams, which then fully integrate to influence a broad array of final outputs. The diagram's purpose is to visualize this specific relational architecture, not to present quantitative data.**