## Charts: Multi-Panel Analysis of Metric Values and Rationality
### Overview
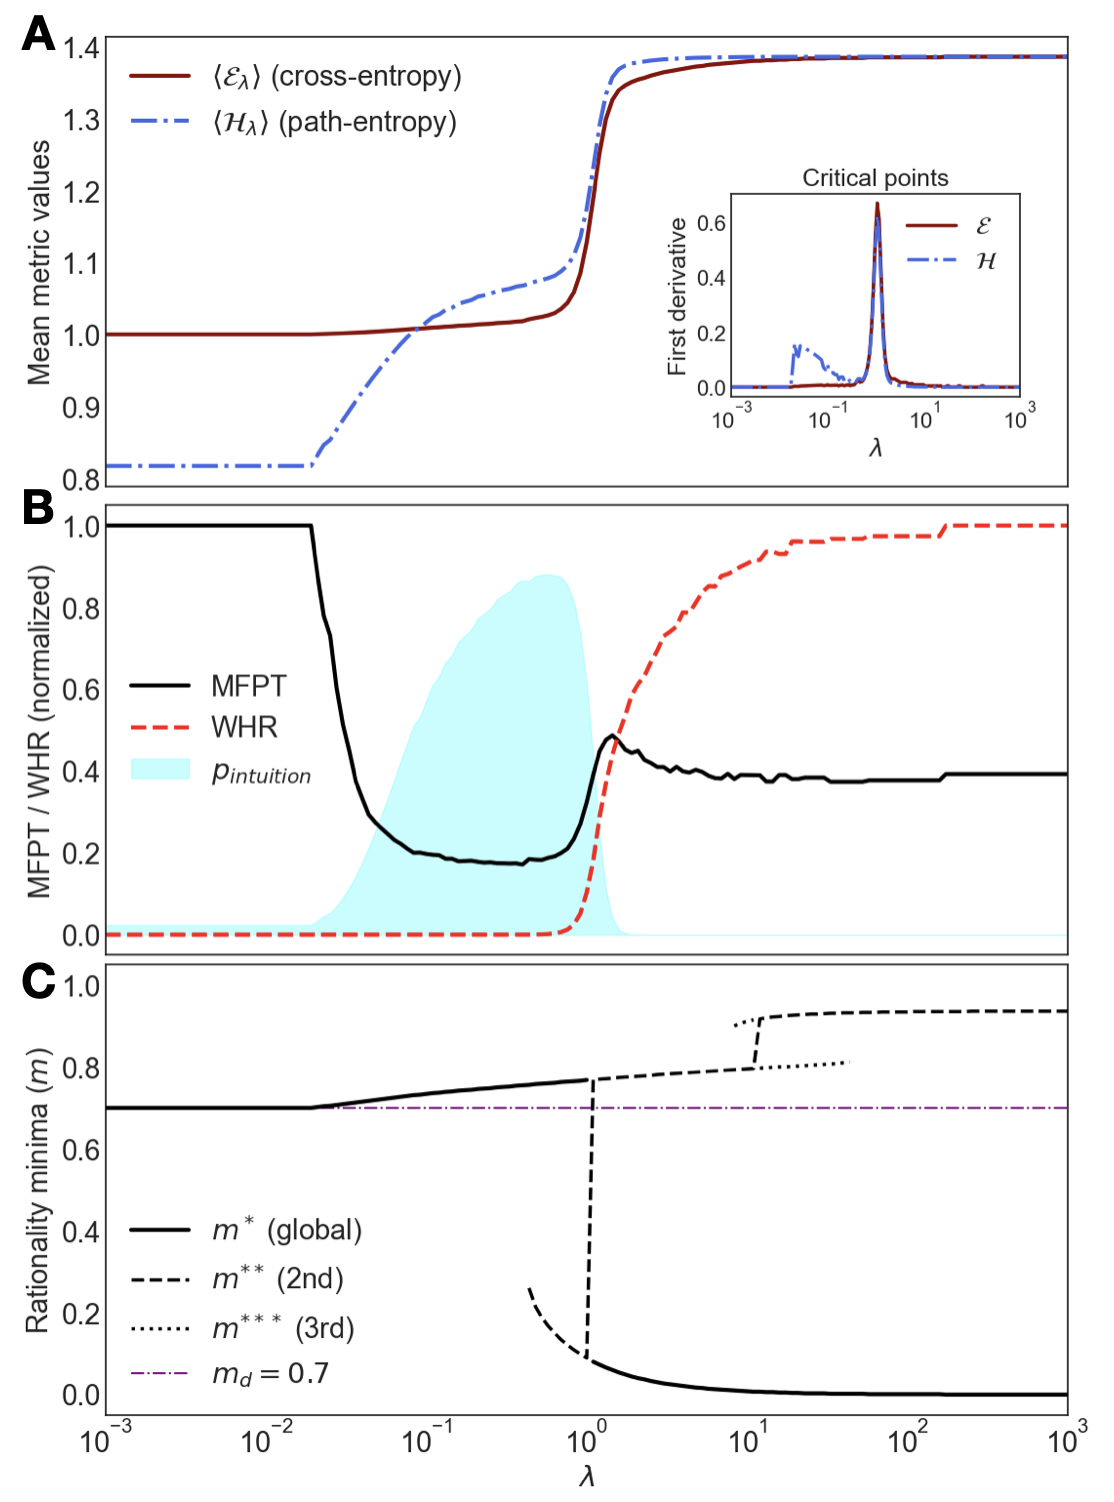
This image presents a multi-panel chart (A, B, and C) analyzing metric values related to entropy, intuition, and rationality as a function of a parameter denoted by λ (lambda). Each panel displays different metrics and their relationships, with a shared x-axis representing λ on a logarithmic scale. Panel A focuses on cross-entropy and path-entropy. Panel B shows the ratio of Mean First Passage Time (MFPT) to Width of the Hole Ratio (WHR), alongside an area representing Pintuition. Panel C illustrates rationality minima.
### Components/Axes
* **X-axis (all panels):** λ (lambda), ranging from 10<sup>-3</sup> to 10<sup>3</sup> on a logarithmic scale.
* **Panel A:**
* **Y-axis:** Mean metric values, ranging from approximately 0.9 to 1.4.
* **Lines:**
* Red solid line: ⟨ε<sub>λ</sub>⟩ (cross-entropy)
* Blue dashed line: ⟨H<sub>λ</sub>⟩ (path-entropy)
* **Inset:** First derivative of ε and H with respect to λ.
* X-axis: λ (lambda), ranging from 10<sup>-3</sup> to 10<sup>3</sup> on a logarithmic scale.
* Y-axis: First derivative (unlabeled).
* Lines:
* Red solid line: ε
* Blue dashed line: H
* **Inset Label:** "Critical points"
* **Panel B:**
* **Y-axis:** MFPT / WHR (normalized), ranging from approximately 0 to 1.0.
* **Lines:**
* Black solid line: MFPT
* Red dashed line: WHR
* **Area:** Light blue shaded area representing Pintuition.
* **Panel C:**
* **Y-axis:** Rationality minima (m), ranging from approximately 0 to 1.0.
* **Lines:**
* Black solid line: m<sup>*</sup> (global)
* Black dashed line: m<sup>**</sup> (2nd)
* Black dotted line: m<sup>***</sup> (3rd)
* Gray dashed line: m<sub>d</sub> = 0.7
### Detailed Analysis or Content Details
**Panel A:**
* The red line (⟨ε<sub>λ</sub>⟩) starts at approximately 1.15 at λ = 10<sup>-3</sup> and initially decreases, reaching a minimum around λ = 0.01, then rapidly increases to approximately 1.38 at λ = 1.
* The blue line (⟨H<sub>λ</sub>⟩) starts at approximately 1.05 at λ = 10<sup>-3</sup> and initially decreases, reaching a minimum around λ = 0.1, then increases more gradually to approximately 1.25 at λ = 1.
* The inset shows the first derivatives of both lines. Both derivatives have a peak around λ = 0.01, indicating a rapid change in both cross-entropy and path-entropy at that point.
**Panel B:**
* The black line (MFPT) starts at approximately 0.2 at λ = 10<sup>-3</sup>, increases to a peak around λ = 0.1 (approximately 0.8), then decreases to approximately 0.4 at λ = 10<sup>3</sup>.
* The red line (WHR) starts at approximately 0.1 at λ = 10<sup>-3</sup>, increases rapidly to a peak around λ = 1 (approximately 0.9), then continues to increase slowly to approximately 0.95 at λ = 10<sup>3</sup>.
* The light blue area (Pintuition) is most prominent between approximately λ = 0.01 and λ = 0.1, indicating a region of significant intuition.
**Panel C:**
* The black solid line (m<sup>*</sup>) starts at approximately 0.8 at λ = 10<sup>-3</sup> and decreases rapidly to approximately 0.2 at λ = 1, then remains relatively constant.
* The black dashed line (m<sup>**</sup>) starts at approximately 0.6 at λ = 10<sup>-3</sup> and decreases to approximately 0.2 at λ = 1, then increases slightly to approximately 0.3 at λ = 10<sup>3</sup>.
* The black dotted line (m<sup>***</sup>) starts at approximately 0.4 at λ = 10<sup>-3</sup> and decreases to approximately 0.2 at λ = 1, then increases more significantly to approximately 0.6 at λ = 10<sup>3</sup>.
* The gray dashed line (m<sub>d</sub> = 0.7) is a horizontal line at y = 0.7.
### Key Observations
* All lines in Panel A exhibit a minimum within the range of λ = 0.01 to 0.1.
* Panel B shows a clear interplay between MFPT and WHR, with Pintuition being most pronounced when both are changing rapidly.
* Panel C demonstrates a decreasing trend in rationality minima (m<sup>*</sup>, m<sup>**</sup>, m<sup>***</sup>) as λ increases, followed by a potential increase for m<sup>**</sup> and m<sup>***</sup> at higher λ values.
* The vertical dashed line at λ = 1 in Panel C appears to mark a transition point in the rationality minima.
### Interpretation
The charts suggest a complex relationship between entropy, intuition, and rationality as influenced by the parameter λ. The initial decrease in cross-entropy and path-entropy (Panel A) may indicate a period of increasing order or predictability. The peak in MFPT and WHR around λ = 0.1 (Panel B) coupled with the prominence of Pintuition suggests a critical point where intuitive reasoning is most valuable. The decreasing rationality minima (Panel C) as λ increases could indicate a loss of rational control or an increased reliance on heuristics. The different levels of rationality minima (m<sup>*</sup>, m<sup>**</sup>, m<sup>***</sup>) may represent different levels of cognitive processing or decision-making strategies. The horizontal line at m<sub>d</sub> = 0.7 could represent a threshold for acceptable rationality. The overall trend suggests a shift from a more rational state at low λ values to a potentially more intuitive or heuristic-driven state at higher λ values. The inset in Panel A highlights critical points where the rate of change in entropy is maximized, potentially indicating phase transitions or bifurcations in the system's behavior.