TECHNICAL ASSET FINGERPRINT
fe39684a26ae5b97b2097966
Click to view fullscreen
Press ESC or click to close
FOUND IN PAPERS
EXPERT: healer-alpha-free VERSION 1
RUNTIME: free/openrouter/healer-alpha
INTEL_VERIFIED
## Multi-panel scientific figure with line graphs and inset
### Overview
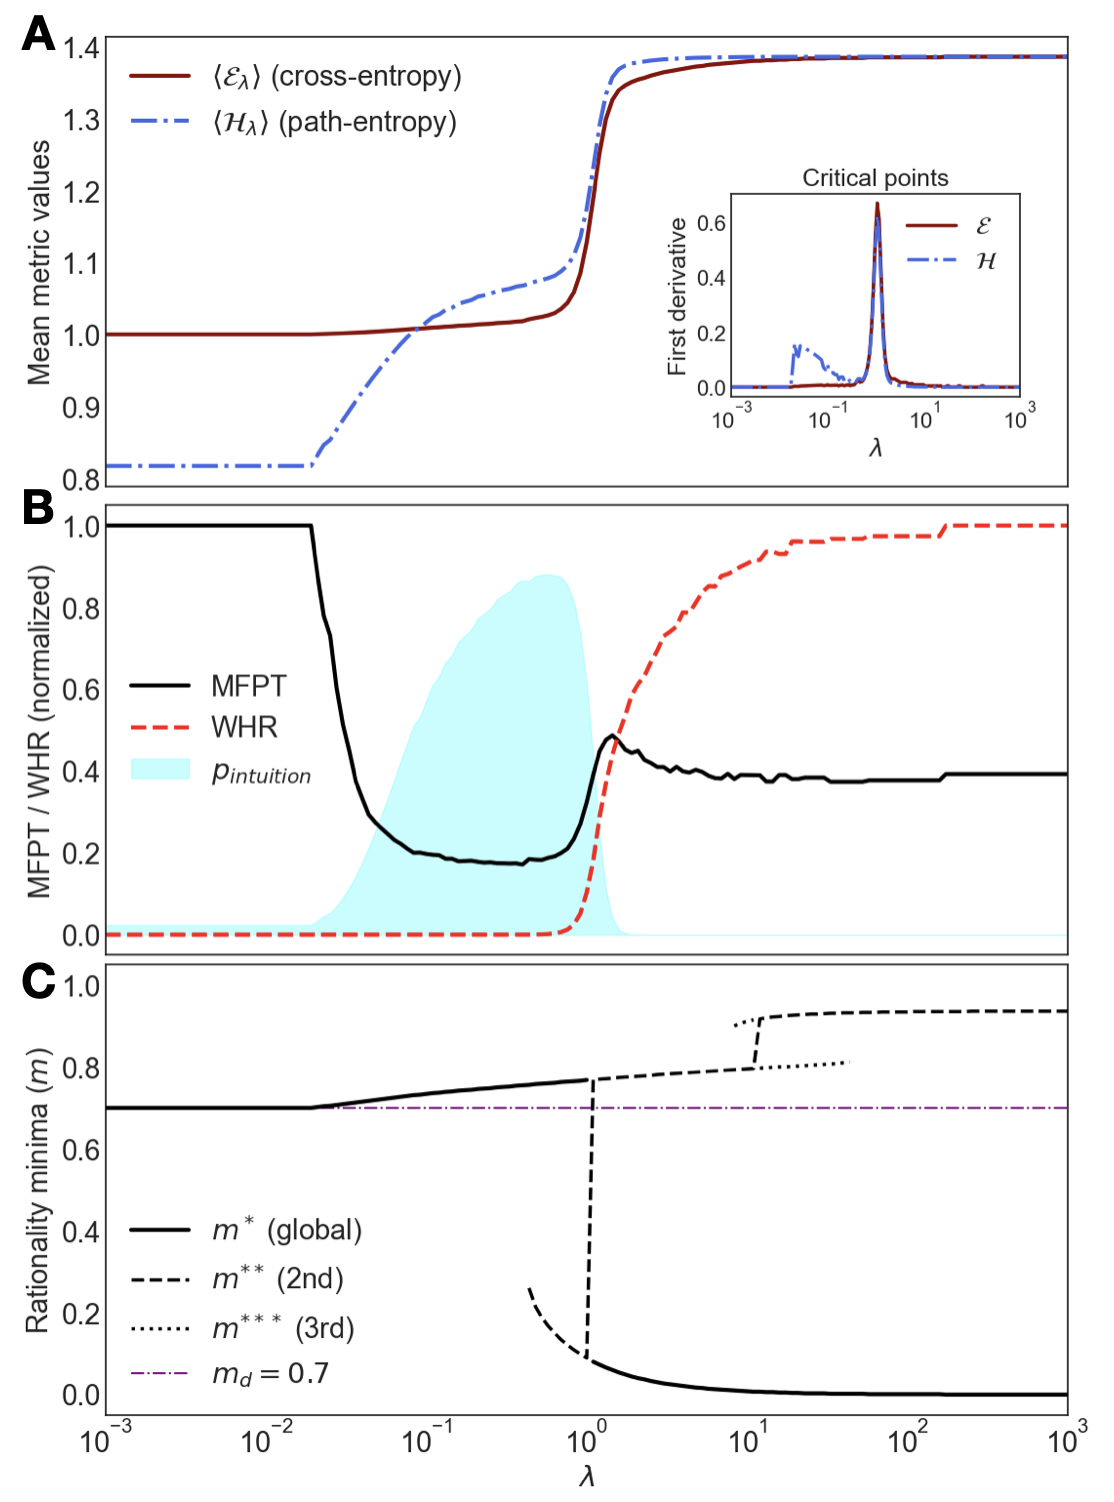
The image is a three-panel scientific figure (labeled A, B, C) displaying various metrics plotted against a parameter λ (lambda) on a logarithmic x-axis. The figure appears to analyze the behavior of a system, likely related to decision-making, rationality, or information theory, as λ varies over six orders of magnitude (10⁻³ to 10³). Each panel shows different but related quantities, suggesting a phase transition or critical point around λ ≈ 10⁰ (λ=1).
### Components/Axes
**Common Elements:**
* **X-axis (All Panels):** Labeled "λ" (lambda). Scale is logarithmic, with major tick marks at 10⁻³, 10⁻², 10⁻¹, 10⁰, 10¹, 10², 10³.
* **Panel Labels:** Large, bold letters "A", "B", "C" in the top-left corner of each respective panel.
**Panel A:**
* **Y-axis:** Labeled "Mean metric values". Linear scale from 0.8 to 1.4.
* **Legend (Top-Left):**
* Solid dark red line: `⟨E_λ⟩ (cross-entropy)`
* Dash-dot blue line: `⟨H_λ⟩ (path-entropy)`
* **Inset Plot (Top-Right of Panel A):**
* **Title:** "Critical points"
* **Y-axis:** Labeled "First derivative". Linear scale from 0.0 to 0.6.
* **X-axis:** Labeled "λ". Logarithmic scale matching the main plot.
* **Legend (Inset, Top-Right):**
* Solid dark red line: `E`
* Dash-dot blue line: `H`
**Panel B:**
* **Y-axis:** Labeled "MFPT / WHR (normalized)". Linear scale from 0.0 to 1.0.
* **Legend (Center-Left):**
* Solid black line: `MFPT`
* Dashed red line: `WHR`
* Light cyan filled area: `p_intuition`
**Panel C:**
* **Y-axis:** Labeled "Rationality minima (m)". Linear scale from 0.0 to 1.0.
* **Legend (Bottom-Left):**
* Solid black line: `m* (global)`
* Dashed black line: `m** (2nd)`
* Dotted black line: `m*** (3rd)`
* Dash-dot purple line: `m_d = 0.7`
### Detailed Analysis
**Panel A: Mean Metric Values**
* **Trend Verification:** Both the cross-entropy (`⟨E_λ⟩`) and path-entropy (`⟨H_λ⟩`) lines show a sigmoidal transition. They start at a low, stable plateau for small λ, undergo a sharp increase centered around λ ≈ 10⁰, and reach a high, stable plateau for large λ.
* **Data Points (Approximate):**
* For λ < 10⁻²: `⟨E_λ⟩` ≈ 1.00, `⟨H_λ⟩` ≈ 0.82.
* Transition Region (10⁻¹ < λ < 10¹): Both metrics rise sharply. The path-entropy (`⟨H_λ⟩`) begins its ascent slightly earlier (around λ=10⁻¹) than the cross-entropy.
* For λ > 10¹: Both metrics plateau. `⟨E_λ⟩` ≈ 1.38, `⟨H_λ⟩` ≈ 1.39. The lines nearly converge at the high plateau.
* **Inset - Critical Points (First Derivatives):**
* The first derivative of both metrics shows a pronounced peak, confirming the location of the steepest change (the critical point).
* The peak for `E` (cross-entropy derivative) is sharper and higher, reaching ~0.65 at λ ≈ 10⁰.
* The peak for `H` (path-entropy derivative) is broader and lower, with a maximum ~0.55 at a similar λ. A smaller, secondary hump in the `H` derivative is visible around λ ≈ 10⁻¹.
**Panel B: MFPT, WHR, and Intuition**
* **Trend Verification:** The Mean First Passage Time (`MFPT`) and Weakly Harmonic Ratio (`WHR`) show an inverse relationship across the transition. The `p_intuition` area highlights the region of transition.
* **Data Points (Approximate):**
* **MFPT (Solid Black):** Starts at a normalized value of 1.0 for λ < 10⁻². Drops sharply between λ=10⁻² and λ=10⁻¹ to a minimum of ~0.18. It then rises to a local peak of ~0.48 at λ ≈ 10⁰ before settling to a stable value of ~0.40 for λ > 10¹.
* **WHR (Dashed Red):** Starts near 0.0 for λ < 10⁻¹. Begins a sharp rise around λ=10⁰, crossing the MFPT line near λ=1. It continues to increase, approaching a plateau of ~1.0 for λ > 10¹.
* **p_intuition (Cyan Area):** This probability distribution is zero for very small and very large λ. It forms a broad peak between λ ≈ 10⁻² and λ ≈ 10⁰, with its maximum density occurring around λ ≈ 10⁻⁰.⁵ (approx. 0.3). This area visually encapsulates the region where MFPT is low and WHR is beginning to rise.
**Panel C: Rationality Minima**
* **Trend Verification:** This panel tracks the location (`m`) of minima in a rationality landscape. The global minimum (`m*`) shifts dramatically, while higher-order minima (`m**`, `m***`) appear and disappear.
* **Data Points (Approximate):**
* **m* (Global, Solid Black):** For λ < 10⁻¹, it is constant at ~0.70. It begins to rise slightly, reaching ~0.77 at λ=10⁰. Immediately after λ=10⁰, it drops precipitously, approaching 0.0 for λ > 10¹.
* **m_d (Dash-dot Purple):** A constant reference line at m = 0.7.
* **m** (2nd, Dashed Black):** Appears abruptly at λ ≈ 10⁰, starting at a low value (~0.1) and rising sharply to join a plateau at ~0.94 for λ > 10¹.
* *** (3rd, Dotted Black):** Appears at a higher λ (≈ 10¹), starting near ~0.8 and showing a slight downward trend.
### Key Observations
1. **Coordinated Phase Transition:** All three panels indicate a major system transition centered at λ ≈ 1 (10⁰). This is evidenced by the sharp rise in entropy metrics (A), the crossover of MFPT and WHR (B), and the dramatic shift in the global rationality minimum `m*` (C).
2. **Critical Point Confirmation:** The inset in Panel A provides mathematical confirmation of the critical point via peaks in the first derivatives of the entropy metrics.
3. **Intuition Region:** Panel B's `p_intuition` area suggests that "intuitive" processing is most probable in the pre-transition regime (λ < 1), where MFPT is low but WHR has not yet risen.
4. **Emergence of Complexity:** Panel C shows that for λ > 1, the rationality landscape becomes more complex, with the emergence of distinct second (`m**`) and third (`m***`) order minima, while the global minimum (`m*`) vanishes toward zero.
### Interpretation
The data collectively suggests a **phase transition in a decision-making or search process** governed by the parameter λ. λ likely represents a trade-off parameter, such as the balance between exploration and exploitation, or between intuitive and deliberative processing.
* **Low λ (λ << 1):** The system is in an "intuitive" or "fast" state. Path-entropy is low, Mean First Passage Time (MFPT) is high (suggesting slow, direct paths?), and the rationality landscape has a single, stable global minimum (`m* ≈ 0.7`).
* **Critical λ (λ ≈ 1):** The system undergoes a rapid reorganization. Entropy increases sharply, indicating greater disorder or exploration. MFPT drops to a minimum (fastest passage?), while the Weakly Harmonic Ratio (WHR) begins to rise, possibly indicating a shift towards more structured, harmonic behavior. The probability of "intuitive" processing (`p_intuition`) peaks here.
* **High λ (λ >> 1):** The system settles into a "rational" or "deliberative" state. Entropy metrics plateau at a high value. WHR dominates over MFPT. Crucially, the rationality landscape changes fundamentally: the original global minimum disappears (`m* → 0`), and new, higher-order minima (`m**`, `m***`) emerge at different `m` values. This implies that the optimal strategy or solution (`m`) has fundamentally changed.
**In essence, the figure illustrates how tuning a single parameter (λ) can drive a system from a simple, intuitive regime through a critical point of maximum change, into a complex, rational regime with a restructured solution landscape.** The transition is not smooth but sharp, characteristic of a phase transition.
DECODING INTELLIGENCE...